Wavefront for Spring Boot allows you to quickly configure your environment, so Spring Boot 2 components send metrics, histograms, and traces/spans to our service.
Features
If you use Wavefront for Spring Boot:
- A large number of metrics are exposed by default. See the Spring Boot documentation on Supported Metrics for details.
- You have tracing support for all the common Spring Boot components, such as Spring MVC, Spring Web, Spring Async, Feign, Hysterix, JMS, JDBC, Mongo, Zuul, Reactor, RxJava, Redis, Logging, Spring Messaging, and RabbitMQ.
- The spans in your applications are automatically converted to our span format.
- You can use either Spring Cloud Sleuth or OpenTracing to send trace data. Pick one and use it across all your microservices.
- If you are using OpenTracing, the logs generated by the logger in your application are automatically converted to span logs, and you can view the span logs in the Traces Browser. You don’t need to change your code.
Sending Data from Spring Boot Into Our Service
You can send data from your Spring Boot applications into our service using the Wavefront for Spring Boot Starter (all users) or the Wavefront Spring Boot integration (customers and free trial users).
- Wavefront for Spring Boot Starter
If you configure your application with the Wavefront for Spring Boot starter, you can send metrics, histograms, and traces/spans to our service. Once the data is in our service, you can view your data, find hotspots, and gather more data.- Freemium: All users can run the Spring Boot Starter with the default settings to view their data in the freemium instance. Certain limitations apply, for example, alerts are not available, but you don’t have to sign up.
- Customer or Free Trial User: Customers or free trial users can modify the default Wavefront Spring Boot Starter to send data to their cluster. You can sign up for a free 30-day trial here.
- Wavefront Spring Boot Integration: Customers and free trial users can access the Wavefront Spring Boot integration directly from their clusters.
Dashboards
After you’ve completed the setup, you can examine the data in our dashboards.
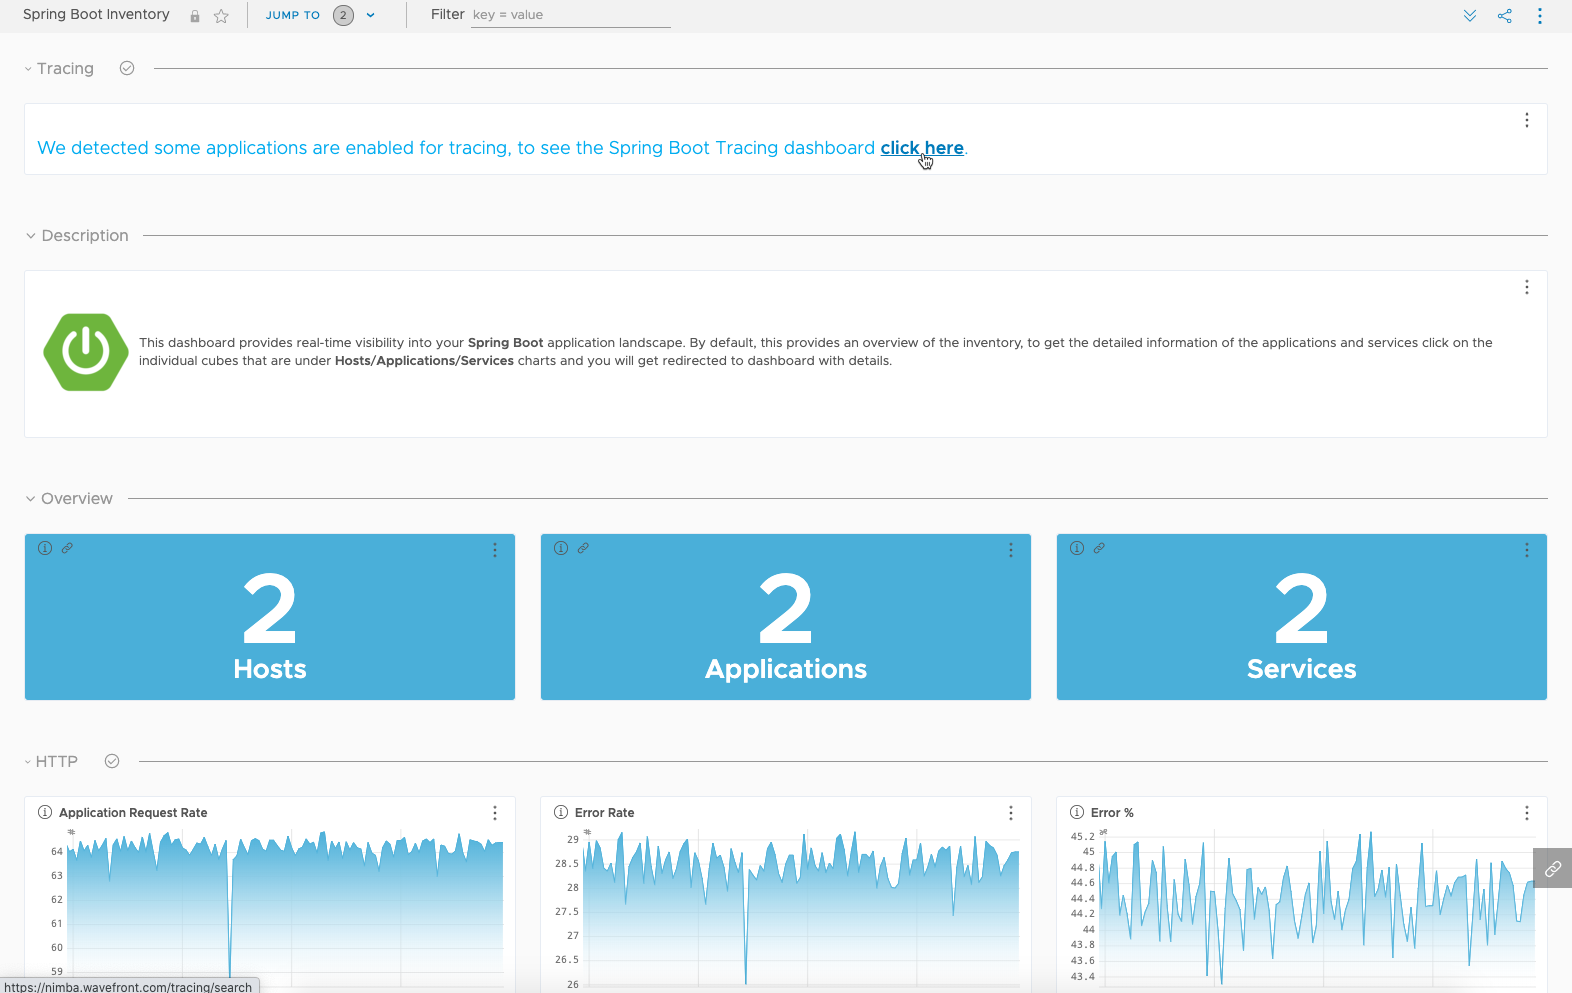
The Spring Boot Inventory dashboard provides real-time visibility into your Spring Boot environment.
|
|
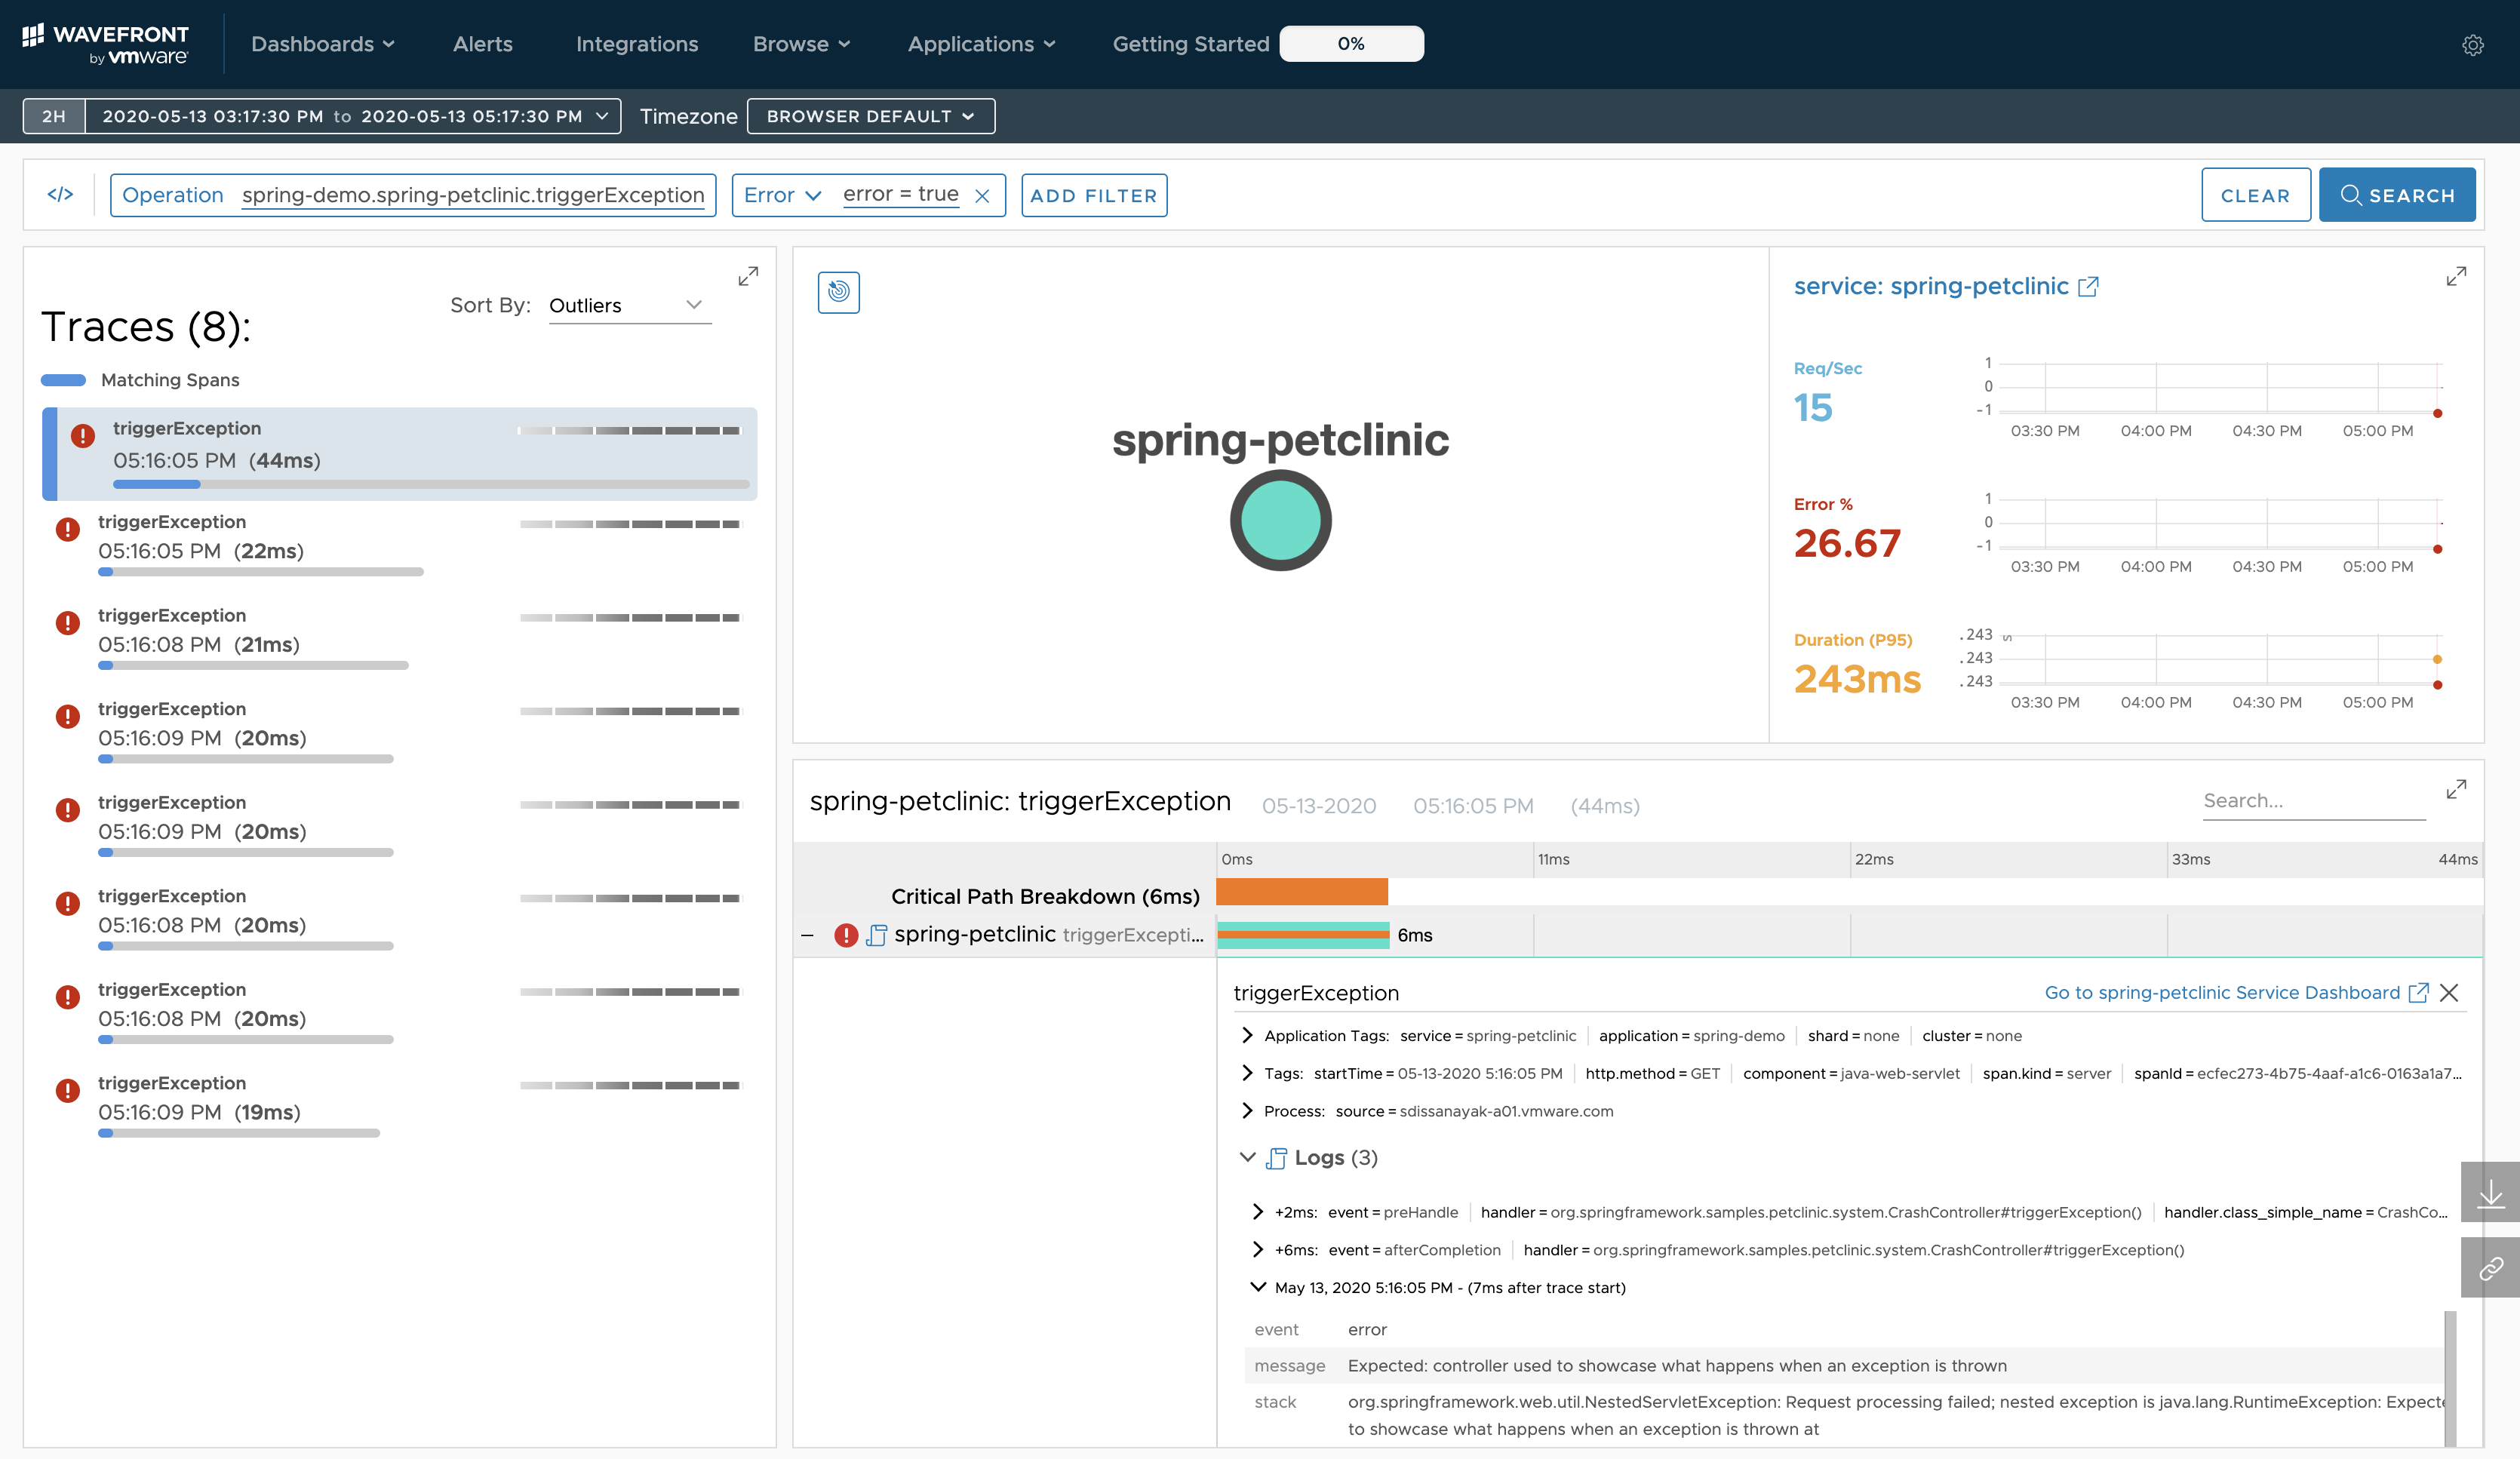
The Traces Browser allows you to examine traces for your applications. You can access this browser if trace data are flowing:
|
|
Getting Started
Getting started is easy. Here are some things to know before you start:
- Ingestion Method: Wavefront for Spring Boot sends data to our service via direct ingestion by default. You can configure your application to send data via the Wavefront proxy.
- Target: Wavefront for Spring Boot sends data to the freemium instance by default. You can configure your application to send data to your Operations for Applications instance.
- Account: By default, the starter sends you to the Freemium instance, auto-negotiates an account, and saves the API token in the
~/.wavefront_freemiumfile in your home directory. If you customize the starter to go to your Operations for Applications instance (see Step 2 below) you need to include an API token for that instance.
Prerequisites for Wavefront Spring Boot Starter
- Spring Boot 2.3.0 or above
Wavefront for Spring Boot Version Spring Boot Version 2.3.x 2.7.x 2.2.x 2.6.x and 2.5.x 2.1.0 2.4.x 2.0.2 2.3.x - Java 8 or above
- Maven 3.3+ or Gradle 6.3 or later
See System Requirements in the Spring Boot documentation.
Step 1: Initialize and Configure Your Project
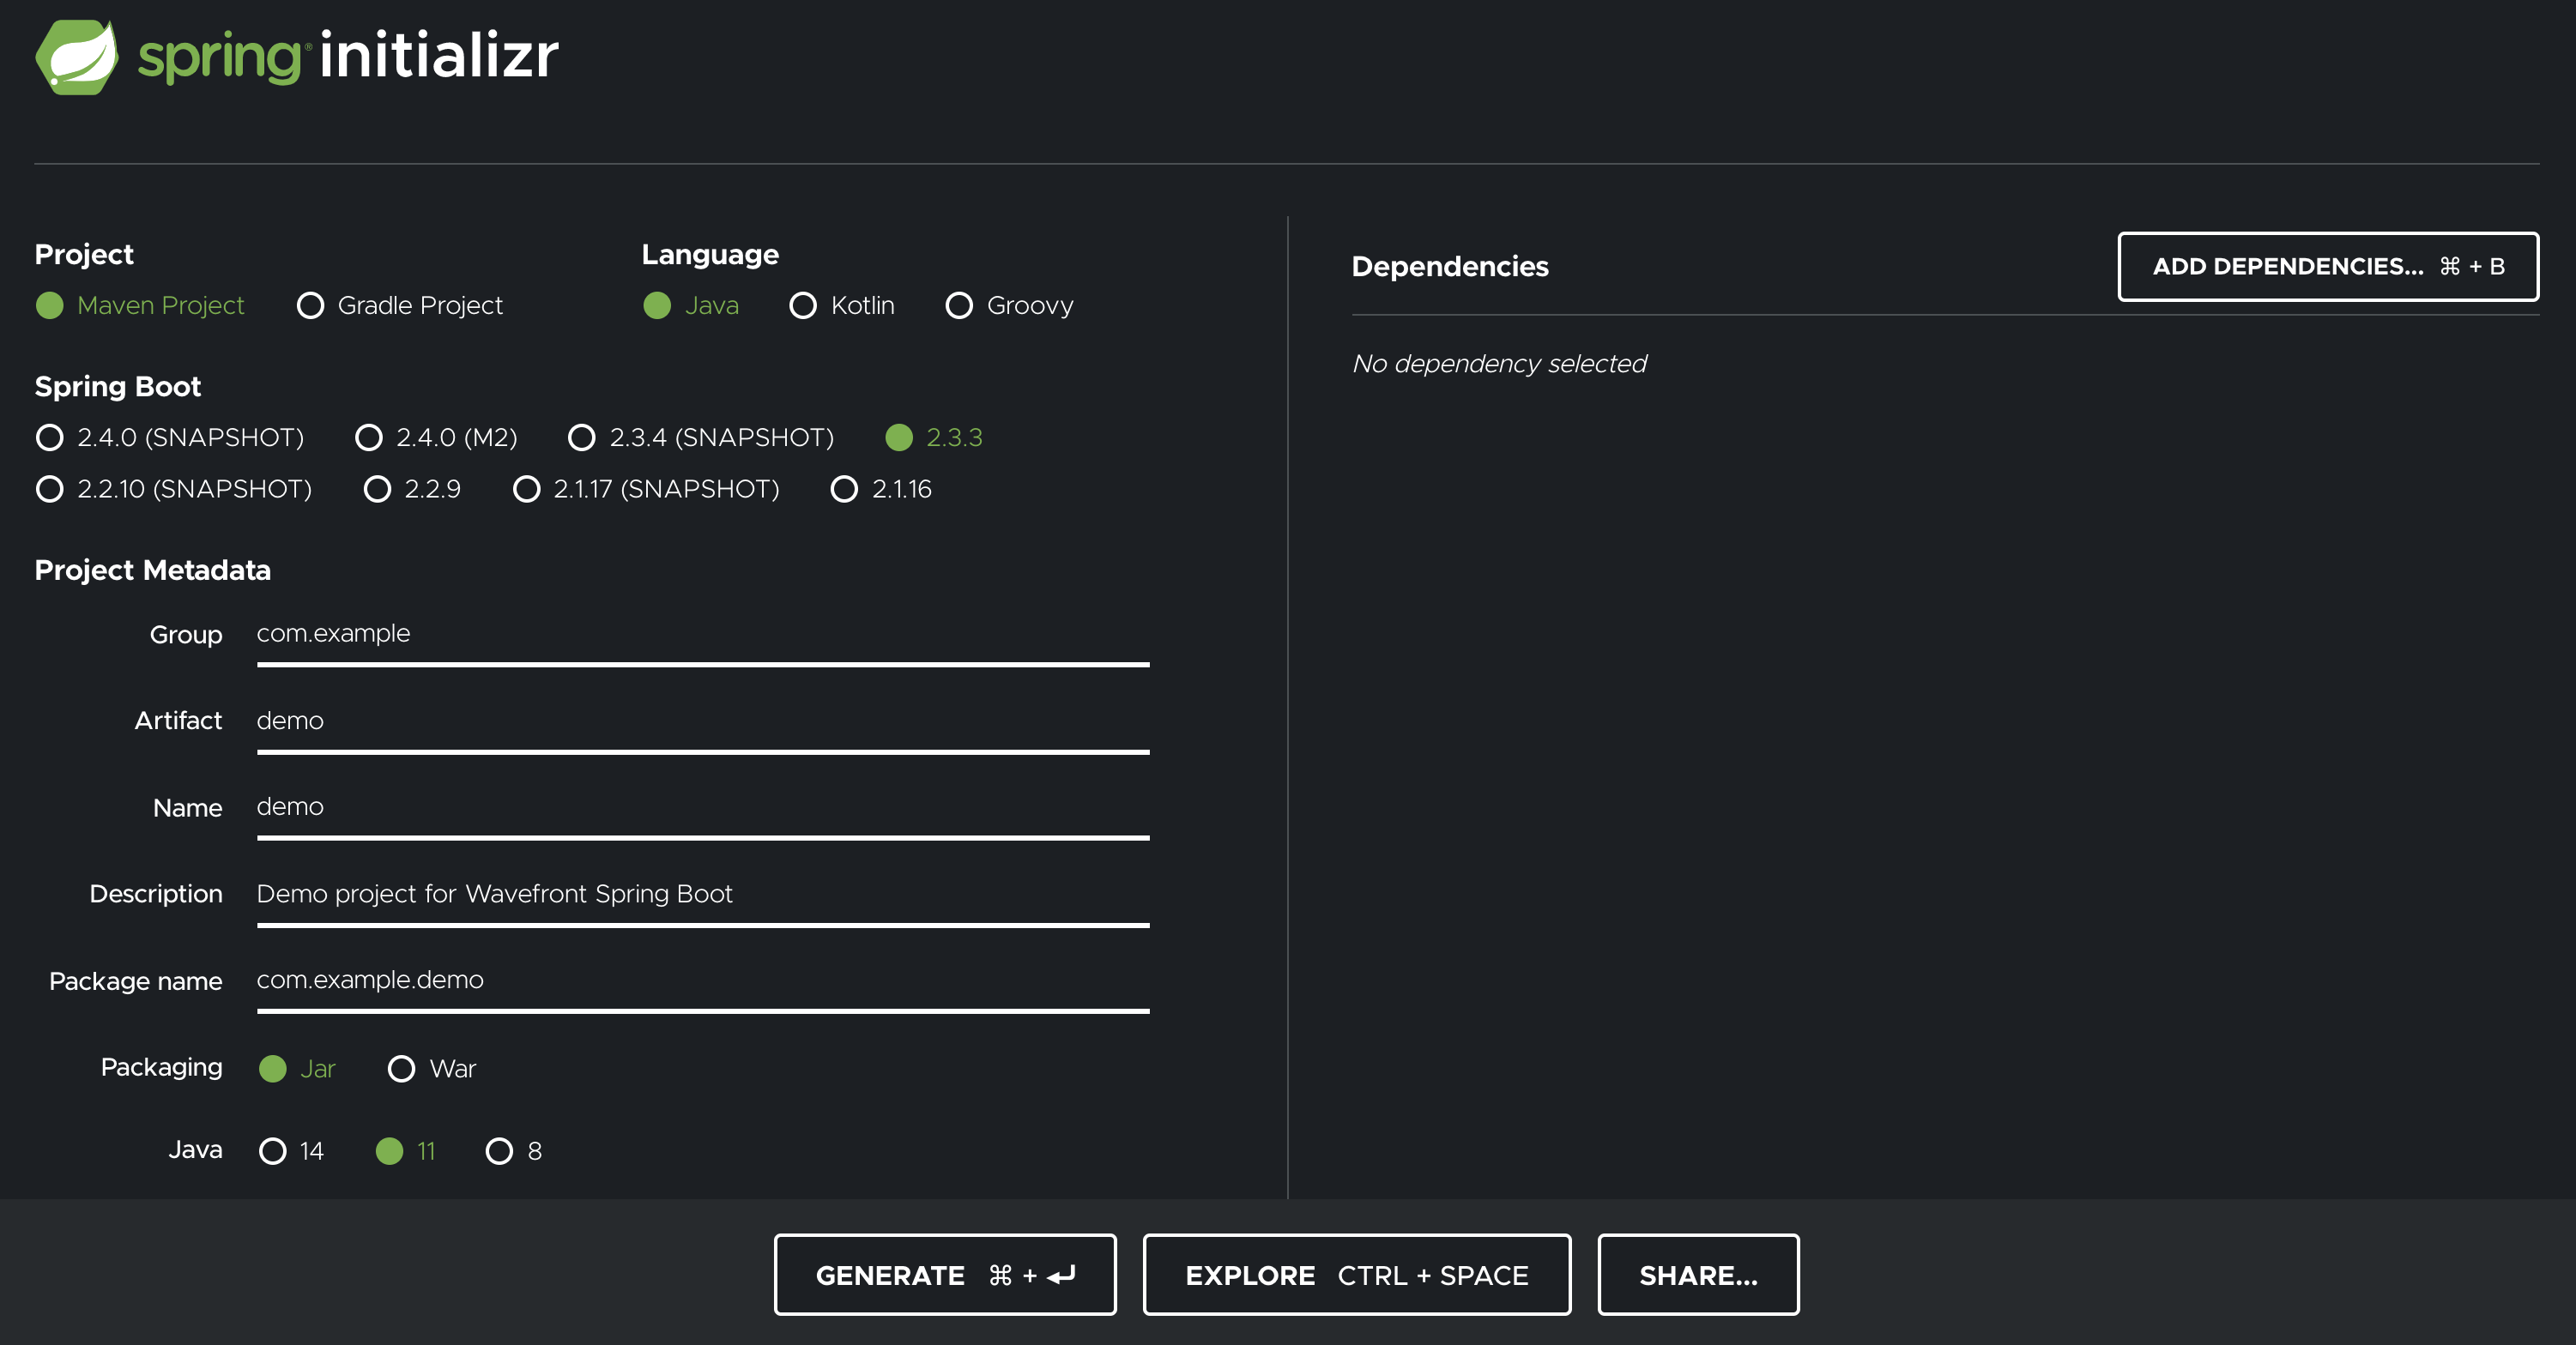
Initialize a new project using the Spring Initializer or add the required dependencies to an existing Spring project to start sending data to our service.
Follow these steps:
- Navigate to https://start.spring.io.
-
Select Spring 2.3.0 or later as the Spring Boot version and define the other parameters for your project.
-
Click Add dependency and select Wavefront from the dependency list.
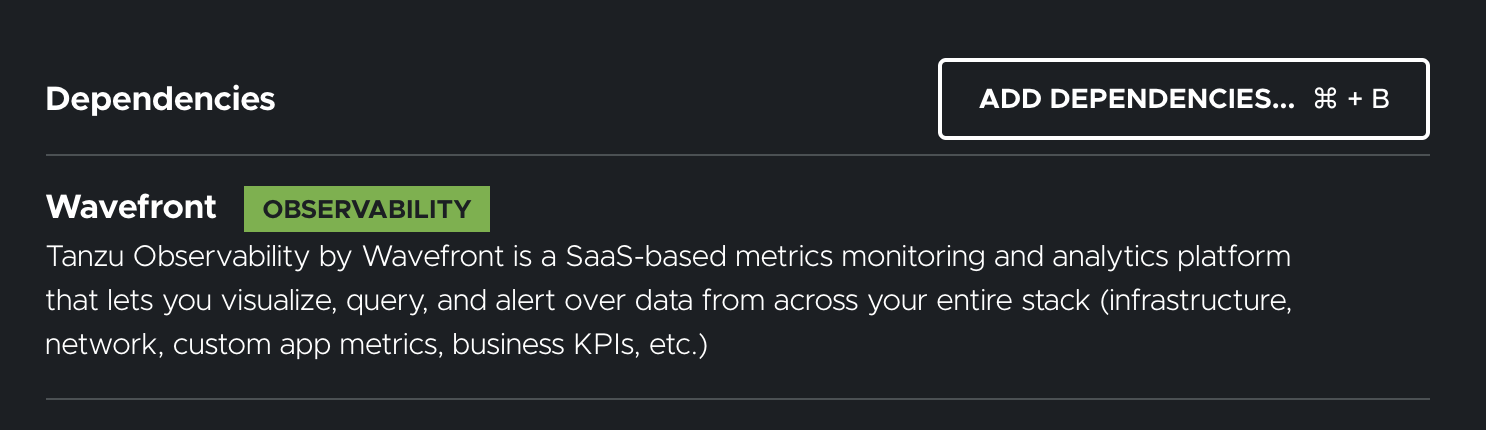 Important:
If you are using the Wavefront dependency and there is no web service in the application, the application stops soon as it starts, and data is not sent to Wavefront. In such cases, make sure to add a dependency under the Web category, such as the Spring Web dependency.
-
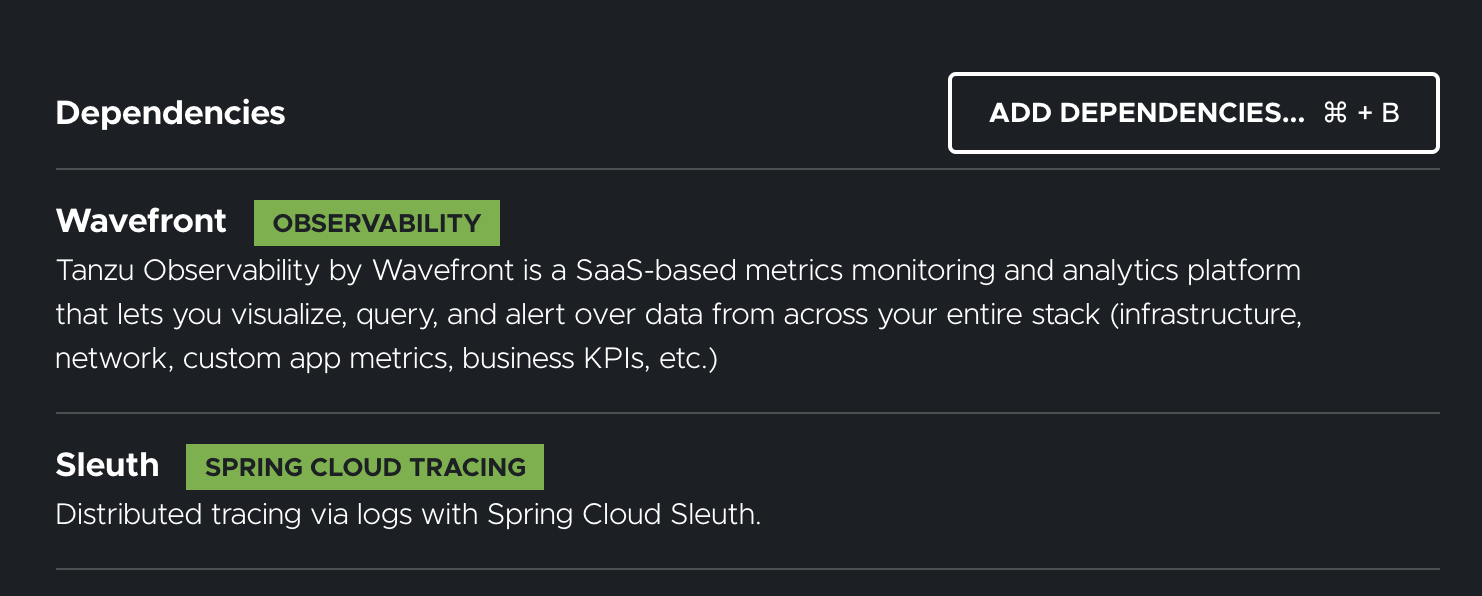
Optionally, to send trace data to Wavefront, add Spring Cloud Sleuth as a dependency.
-
Click Generate to download the project as a zip file.
Tip: To check out all the dependencies and the versions used in your project click Explore.
-
Open the project, add the application logic, and start the project.
Follow these steps:
- Add the Wavefront dependency.
Open your application and add the following code to your
pom.xmlfile.<dependency> <groupId>com.wavefront</groupId> <artifactId>wavefront-spring-boot-starter</artifactId> </dependency>Open your application and add the following code to your
build.gradlefile.dependencies { ... implementation 'com.wavefront:wavefront-spring-boot-starter:$releaseVersion' } -
Import the Wavefront for Spring Boot Bill of Materials (BOM) to your project.
Tip:
The Wavefront for Spring Boot dependency needs to be compatible with the Spring Boot release version. Therefore, replace
$releaseVersionwith the correct dependency version. See System Requirements to get the correct dependency version.<dependencyManagement> <dependencies> ..... <dependency> <groupId>com.wavefront</groupId> <artifactId>wavefront-spring-boot-bom</artifactId> <version>$releaseVersion</version> <type>pom</type> <scope>import</scope> </dependency> ..... </dependencies> </dependencyManagement>dependencyManagement { imports { mavenBom "com.wavefront:wavefront-spring-boot-bom:$releaseVersion" } } -
If you want to send trace data to our service using Spring Cloud Sleuth or OpenTracing, add the following dependencies.
- Maven
- Open your application and add the following code to your
pom.xmlfile.<dependency> <groupId>org.springframework.cloud</groupId> <artifactId>spring-cloud-starter-sleuth</artifactId> </dependency> -
Import the Spring Cloud Bill of Materials (BOM) to your project.
Tip:
The Spring Cloud dependency needs to be compatible with the Spring Boot release version. Therefore, replace
$springCloudVersionwith the correct dependency version. See Getting Started on the Spring Cloud documentation for details.<dependencyManagement> <dependencies> ..... <dependency> <groupId>org.springframework.cloud</groupId> <artifactId>spring-cloud-dependencies</artifactId> <version>$springCloudVersion</version> <type>pom</type> <scope>import</scope> </dependency> ..... <dependencies> <dependencyManagement>
- Gradle
- Open your application and add the following code to your
build.gradlefile.dependencies { ... implementation 'org.springframework.cloud:spring-cloud-starter-sleuth' } -
Import the Spring Cloud Bill of Materials (BOM) to your project. Add the following code under <dependencyManagement>.
Tip:
The Spring Cloud dependency needs to be compatible with the Spring Boot release version. Therefore, replace
$springCloudVersionwith the correct dependency version. See Getting Started on the Spring Cloud documentation for details.dependencyManagement { imports { ... mavenBom "org.springframework.cloud:spring-cloud-dependencies:$springCloudVersion" }
Maven:
Open your application and add the following code to yourpom.xmlfile. The logs generated by the logger in your application will be automatically converted to span logs, and you can view the span logs in the Traces Browser.<dependency> <groupId>io.opentracing.contrib</groupId> <artifactId>opentracing-spring-cloud-starter</artifactId> <version>0.5.7</version> </dependency>Gradle:
Open your application and add the following code to yourbuild.gradlefile.dependencies { ... implementation 'io.opentracing.contrib:opentracing-spring-cloud-starter:0.5.7' }
Step 2 (Optional): Specify Your Operations for Applications Instance
By default, the Wavefront Spring Boot Starter creates an account for you and sends data to the Freemium instance. If you already have an Operations for Applications account, you can send data there instead by specifying the uri and api-token properties, as follows:
management.metrics.export.wavefront.api-token=$API_Token
management.metrics.export.wavefront.uri=$wavefront_instance
$API_Tokenis a valid API token for your Operations for Applications instance.$wavefront_instanceis the name of your Operations for Applications instance, for example,https://example.wavefront.com.
Step 3: View Your Data in Our Service
To view your data, you first run your project from the command line, and then click the link that directs you to our service. Follow these steps:
- Run your project.
Note: If you’re using the Freemium instance, an account is auto-negotiated or restored from
~/.wavefront_freemiumin your home directory each time the application starts. Otherwise, you’re directed to the instance you specified../mvnw spring-boot:run./gradlew bootRunYou see the following printed on your console:
The following example shows what you see if you’re using the Freemium instance:To share this account, make sure the following is added to your configuration: management.metrics.export.wavefront.api-token=44444-34this-45is-123a-sampletoken management.metrics.export.wavefront.uri=https://wavefront.surf Connect to your Wavefront dashboard using this one-time use link: https://wavefront.surf/us/example - Add data to your application before you start to view the data in our service.
Tip: Try out the Wavefront for Spring Boot Tutorial.
- Click the link (for example,
https://wavefront.surf/us/<name>) and you are taken to the Wavefront Spring Boot Inventory dashboard where you can examine the data sent by your application.
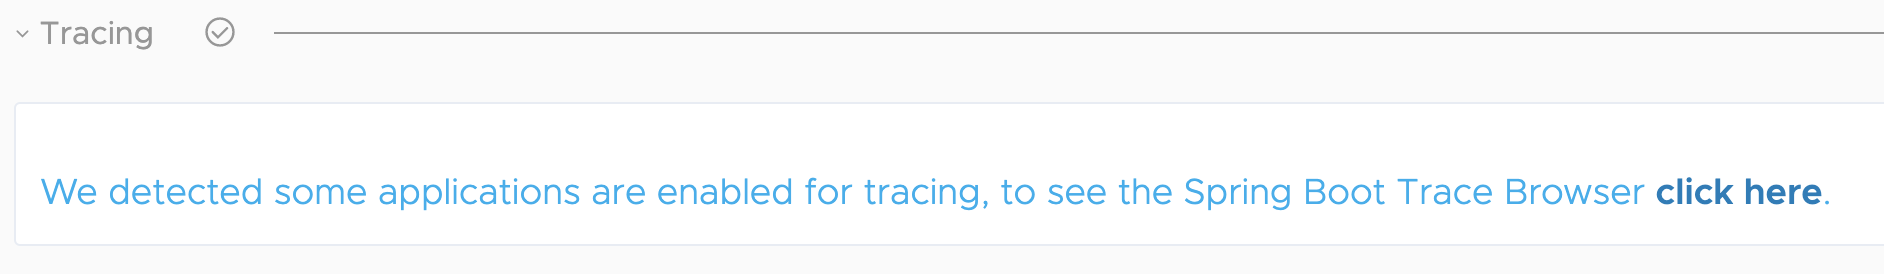
Example: If your application uses trace data, click the link in the Tracing section of the dashboard to be directed to the Traces Browser.
Example: Note: Want to see the cool information you can gather from the Traces Browser? See Explore the Traces Browser.
Custom Configurations
Add the following custom configurations to the application.properties file.
Invite Users
You can invite users and let them send data to the same cluster:
- Click the link that was printed on your console and navigate to the Wavefront for Spring Boot Service Dashboard:
Note: Save the link that you used to access the Service Dashboard.
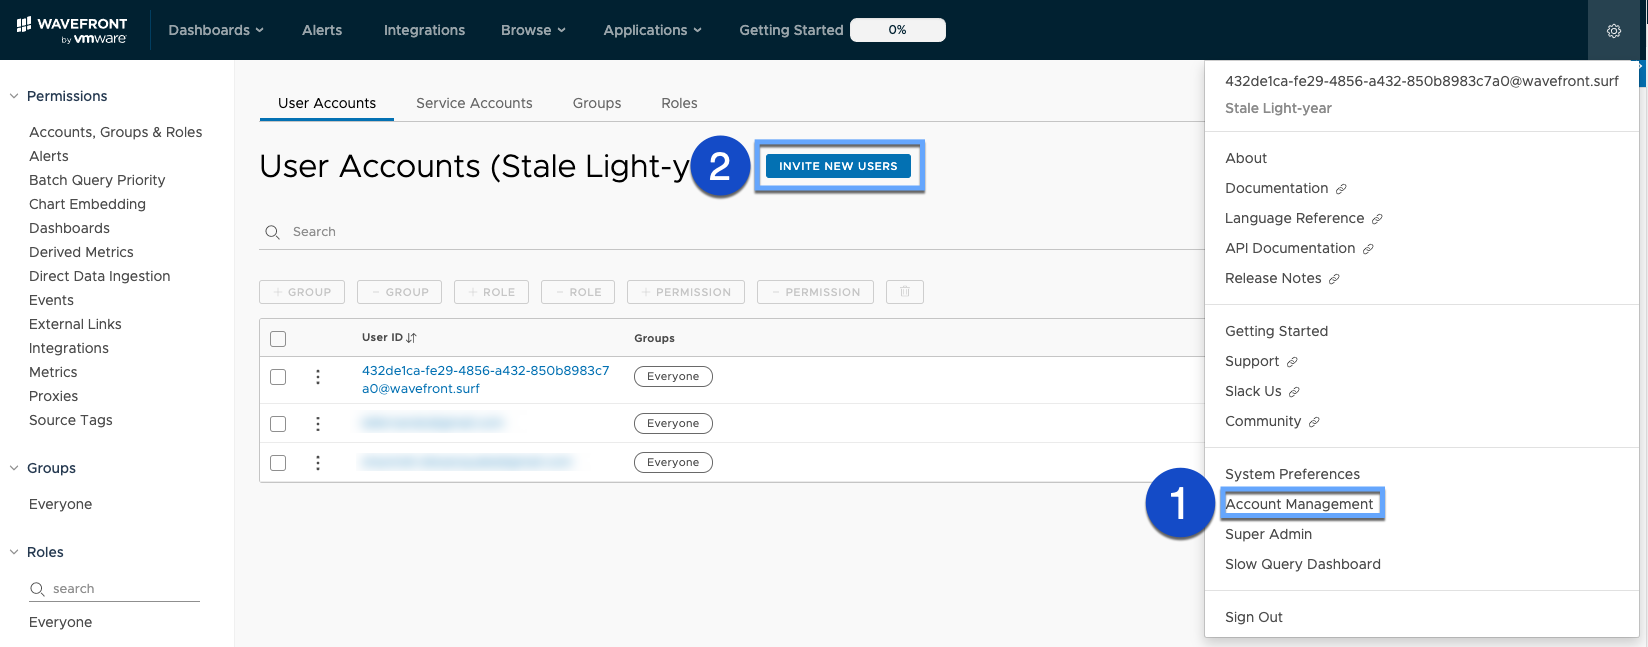
- Click the gear icon and select Accounts.
- Click Invite New Users and specify a comma-separated list of email addresses.
 The users will get an email with a link to reset their password. They can then access your dashboard.
- Information about the token and URL are displayed on your terminal. Add them to your project’s
application.propertiesfile.management.metrics.export.wavefront.api-token=<Enter_Token> management.metrics.export.wavefront.uri=https://wavefront.surf - If you are using the freemium account and want the single-use login URL to show on the terminal each time you start the application, add
wavefront.freemium-accountto theapplication.propertiesfile and set it totrue.wavefront.freemium-account=trueTip: If you don’t want Operations for Applications to auto-negotiate a freemium account for you, set the value tofalse. - Restart your application.
Use the Wavefront Proxy
The Wavefront proxy ingests data and forwards it to our service in a secure, fast, and reliable manner. It prevents data loss, simplifies firewall configuration, and allows you to filter or enrich data before it is sent to our service.
Copy and paste the following property.
management.metrics.export.wavefront.uri=proxy://<Proxy_Host>:2878
Access the Dashboard with the Actuator Endpoint
If you have a web app, you can expose the Operations for Applications Actuator endpoint at /actuator/wavefront to access your Operations for Applications dashboard.
Example:
management.endpoints.web.exposure.include=health,info,...,wavefront
Specify Application and Service Names
If you have more than one Spring Boot application, you can specify the names of the application and the service in the application.properties file.
The valid characters in an application and service name are: a-z, A-Z, 0-9, hyphen ("-"), underscore ("_"), dot ("."), forward slash ("/") and comma (",").
If your application or service names have any other characters other than the valid characters, our service replaces each of those characters with a hyphen ("-").
Example:
wavefront.application.name=my-application
wavefront.application.service=my-service
Example: If you are using a YAML file.
wavefront:
  application:
    name: my-application
    service: my-service
Optionally:
- If you configured
spring.application.namein your application, it is automatically used as the service name.
You can configure the cluster and shard the same way. This information is used to tag metrics and traces.
- If you want to take full control over
ApplicationTags, you can create a@Bean. - If you want to customize the instance that is auto-configured, add an
ApplicationTagsBuilderCustomizerbean.
Wavefront Spring Boot Integration
If you already have an Operations for Applications account, you can start the setup and examine the dashboards from the Wavefront Spring Boot integration. This is supported for free trial accounts.
- Select Integrations, search for Spring Boot, and click the Spring Boot integration.
- Use the information displayed on the Setup tab to set up the integration.
- When setup is complete, click the Dashboard tab to examine your data.
Next Steps
- Try out the Wavefront for Spring Boot Tutorial and see how you can send your data to Wavefront in a few simple steps!
- See the Wavefront for Spring Boot FAQs.