VMware Aria Operations for Applications (formerly known as Tanzu Observability by Wavefront) enables you to configure alerts that inform you about machine or application faults. When a machine or application crashes, it stops reporting data to Operations for Applications – the data from that source is missing.
This explains how to configure alerts that detect missing data, so you can identify potential failures and resolve them.
What Is Missing Data?
When a time series stops reporting, charts show NO DATA where you’d expect to see data points. These expected but unreported data points are called missing data.
Missing data might result from:
- Serious faults that require intervention to correct. For example:
- A time series might stop reporting data because the source of the series (an application, service, or host machine) has crashed and can no longer generate data points or send them to Operations for Applications.
- An application might malfunction intermittently so that it repeatedly stops sending points for short periods of time before resuming.
- Brief interruptions that resolve on their own. For example, a time series might skip data points because a minor network problem has dropped a few packets.
You normally alert on missing data to discover any serious faults that might occur. Configure your alerts to be:
- Sensitive enough to detect missing data in time to avoid significant downtime.
- Robust enough to ignore brief, insignificant interruptions.
This page describes 2 techniques for alerting on missing data:
- Alerting on an entire group of time series that fail together.
- Alerting on one or more individual time series within a group.
Alerting on Time Series that Fail Together
You can configure an alert to notify you when a group of time series all stop reporting data. To do so, you create a custom alert target with the trigger set to Alert Has No Data.
Example
Suppose you are collecting a metric my.metric from 2 copies of a service that are each running on a different host machine (app-1, app-2). You aren’t concerned if either app-1 or app-2 fails by itself, but you need to know if both sources fail concurrently.
- Create a custom alert target whose trigger is set to Alert Has No Data.
- Create the alert with Condition set to
ts(my.metric), and Alert Target set to the custom target.
If both time series stop reporting, the alert does not fire, but enters a NO DATA state. As a result, we send a notification to the custom alert target.
Alerting on Missing Data in Individual Time Series
You can configure an alert to fire when at least one time series in a group stops reporting. To do so, you set up an alert condition that detects missing data in the specified time series as follows:
- Use the
mcount()function to measure the number of reported data points, relative to a chosen time window. - Compare the count to 0 (or some other threshold).
The mcount() function updates its count continuously by shifting the time window forward in time and then counting the number of data points that were reported in the now re-positioned window. The process of returning an updated moving count is repeated once a second, regardless of how frequently the time series reports its data points.
Example
Suppose you are collecting a metric my.metric from each of 4 services that are running on different host machines (app-1, app-2, app-3, app-4). You want to know if any one of these hosts fails, even if the services on the other hosts keep reporting data. To accomplish this, you create an alert with an alert condition such as the following:
mcount(3m, ts(my.metric)) = 0
This alert condition returns true if my.metric does not report any data points for 3 minutes on at least one source.
Detecting Complete Faults and Intermittent Faults
Different amounts of missing data can indicate the severity of a fault. In general, a complete failure to report data is more severe than an intermittent failure. You can detect different amounts of missing data by picking different comparison counts for your alert condition.
-
To find out whether a time series has stopped reporting completely, compare the result of
mcount()to 0:mcount(3m, ts(my.metric)) = 0 -
To find out whether a time series is reporting intermittently, compare the result of
mcount()to some threshold. For example, ifmy.metricnormally reports 1 data point per minute, the following alert condition returns true when 2 or more data points are missing in a 5-minute window:mcount(5m, ts(my.metric)) <= 3Tip: You base the threshold on the number of points you expect the time series to report in the chosen interval. The expected count is easiest to estimate for a time series that reports regularly, such as once a minute or once every 20 seconds. -
To find out whether a time series is reporting fewer and fewer points over time, compare the current moving count to a moving count from an earlier part of the same time series. See Alert on Point Rate Drop on the recipes page.
Controlling Alert Responsiveness
When you use mcount() in an alert condition, the length of the function’s shifting time window affects how quickly the alert responds to a time series that stops reporting. This factor is independent of the length of the Trigger Window. The maximum number of minutes between the last reported data point and the alert’s firing time is given by the following formula:
mcount's shifting time window + Trigger Window time window
Example
Suppose you configure an alert with the following properties:
- The alert condition is
mcount(3m, ts(my.metric)) = 0, so the shifting time window is 3 minutes. - Trigger Window is 2 minutes.
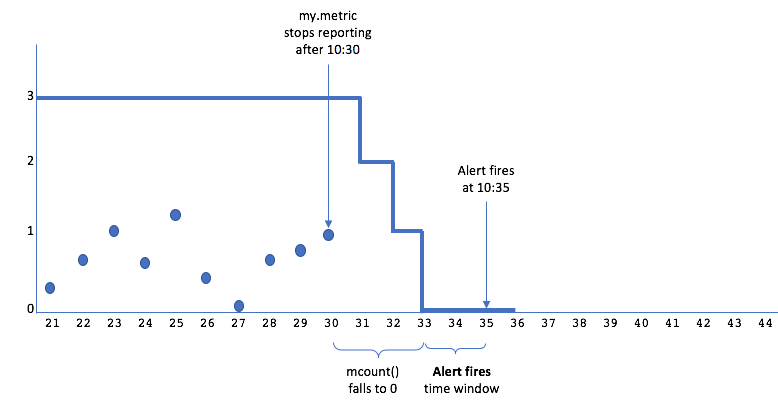
Now consider what happens if my.metric reports regularly once a minute until 10:30 and then stops:
mcount()counts 3 points in every 3-minute shifting window through 10:30:59. Then the moving counts decrease over the next 3 minutes: 2 points through 10:31:59, 1 point through 10:32:59, and finally, 0 points at 10:33 and beyond.- The alert checking system combines the per-second moving counts into summarization points: 3 at 10:30, 2 at 10:31, 1 at 10:32, and 0 at 10:33, 10:34, and so on.
- When the alert condition compares each summarization value to 0, the result is false until 10:33.
- The alert fires at 10:35, based on 2 minutes’ worth (10:33 and 10:34) of true values and no false values. The total elapsed time between the last reported data point and the alert firing is 3+2 = 5 minutes.
Note: The elapsed time will be shorter for an alert condition such as
mcount(3m, ts(my.metric)) < 3, when the Trigger Window time window can overlap the shifting time window.
When you choose a shifting time window for mcount(), you make a trade-off between the alert’s timeliness and its sensitivity to insignificant reporting gaps. A shifting time window should be:
- Short enough so that you don’t wait too long for the alert to fire after the time series stops reporting.
- Long enough so that the alert can ignore slight variations in reporting times or extremely brief reporting gaps.
Options for Responding to Long Data Gaps
When you use mcount() in an alert condition to detect missing data, you need to decide what you want your alert to do if the time series stops reporting for a long time. mcount() returns decreasing values for 1x the length of the shifting time window, then reports 0 for 1x the length of the shifting time window, and then reports NO DATA after that.
You can choose the alert response that best fits your use case:
- Let the alert resolve after
mcount()starts reporting NO DATA. - Configure the alert to continue firing until the time series starts reporting again.
Option 1: Let the Alert Resolve
An alert will automatically resolve if it detects NO DATA for the duration of the Resolve Window time window. Letting the alert resolve makes sense if the time series is unlikely to start reporting again without explicit intervention.
Example
Consider the alert that we described above:
- The alert condition is
mcount(3m, ts(my.metric)) = 0, so the shifting time window is 3 minutes. - Trigger Window time window is 2 minutes.
- Resolve Window time window is 2 minutes.
- The time series
my.metricreports regularly once a minute.
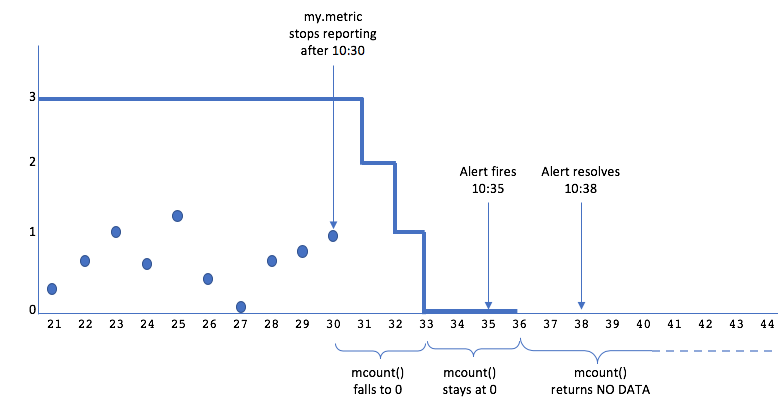
Now consider what happens if the time series stops reporting at 10:30 (and does not restart):
- The alert fires at 10:35.
mcount()stops returning values after 6 minutes (2x the length of the shifting time window).- After 2 minutes of NO DATA, the alert resolves at 10:38, because there have been no false values for the length of the Alert resolves time window.
Option 2: Configure the Alert to Keep Firing
You can configure the alert, so it continues to fire unless the time series starts reporting normally again.
Example
Consider the alert that we described above. Suppose you want this alert to keep firing until my.metric starts reporting data points again, and you think that is likely to happen within an hour. You modify the alert condition by wrapping last() around mcount():
last(1h, mcount(3m, ts(my.metric))) = 0
last() causes mcount() to continue returning its last value (0) instead of reporting NO DATA. Consequently, the alert condition continues to evaluate to true, and the alert continues to fire. This example extends the 0 value for 1 hour. If there is no change to my.metric when the hour is up, mcount() will stop returning 0, and the alert will resolve after 2 minutes of NO DATA.