VMware Aria Operations for Applications (formerly known as Tanzu Observability by Wavefront) comes with a number of internal metrics that track the usage of your Operations for Applications instance and provides you with ways to interpret these metrics by using the Wavefront Query Language (WQL). The broad categories of these internal metrics (or Operations for Applications Stats) are alerts, users, and dashboards. Our SaaS Value Engineering team has put together some best practices to monitor the Operations for Applications adoption.
You can use WQL to access Operations for Applications Stats at ~wavefront. namespace. To see the full list of metrics, in the GUI, click Browse > Metrics and search for ~wavefront.
Let’s take a detailed look at what is available and how you can interpret this data.
Track the Number of Alerts
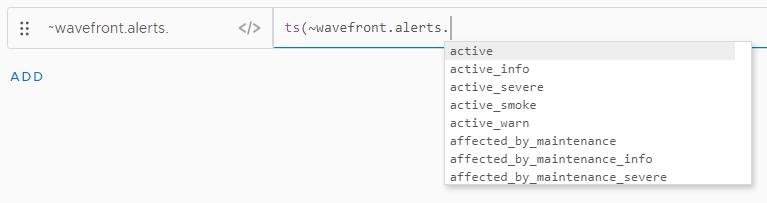
Ever wondered how many alerts your users have created over time? How many of these alerts are active at a given time, or how many of them are severe and active at a given time? Operations for Applications provides granular metrics for all alerts configured for your instance under the ~wavefront.alerts namespace. Some of the metrics that we’ve made available to you under the ~wavefront.alerts namespace are:
~wavefront.alerts.active~wavefront.alerts.active_info~wavefront.alerts.active_severe~wavefront.alerts.active_smoke~wavefront.alerts.active_warn~wavefront.alerts.affected_by_maintenance~wavefront.alerts.affected_by_maintenance_info~wavefront.alerts.affected_by_maintenance_severe~wavefront.alerts.affected_by_maintenance_smoke~wavefront.alerts.affected_by_maintenance_warn~wavefront.alerts.all
For example:
-
To see the total number of alerts configured over time, use the
~wavefront.alerts.allmetric: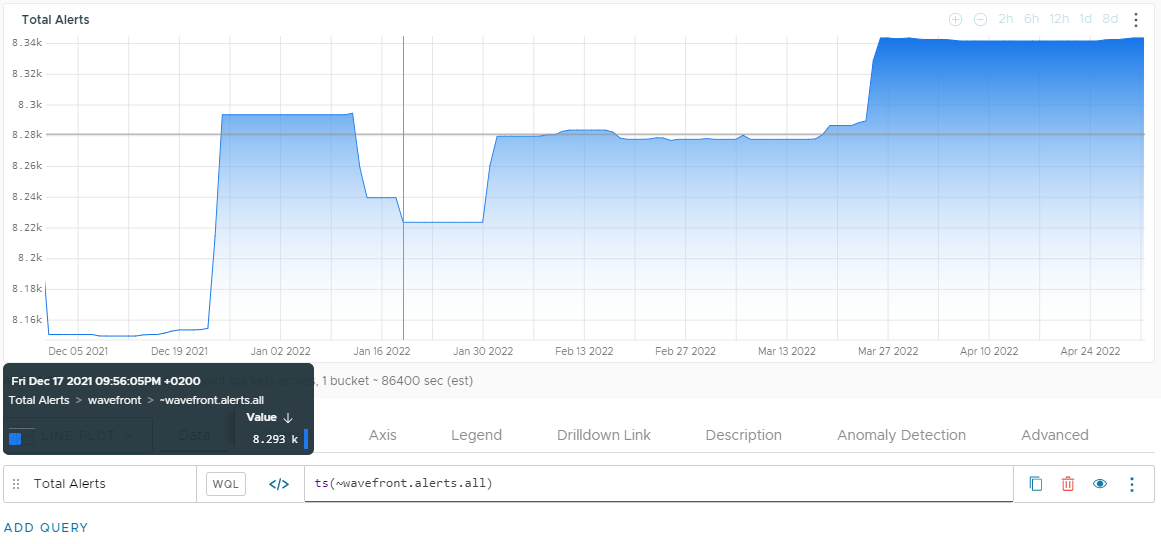
-
To see how many alerts were active at a certain time, create a chart by using the
~wavefront.alerts.activemetric: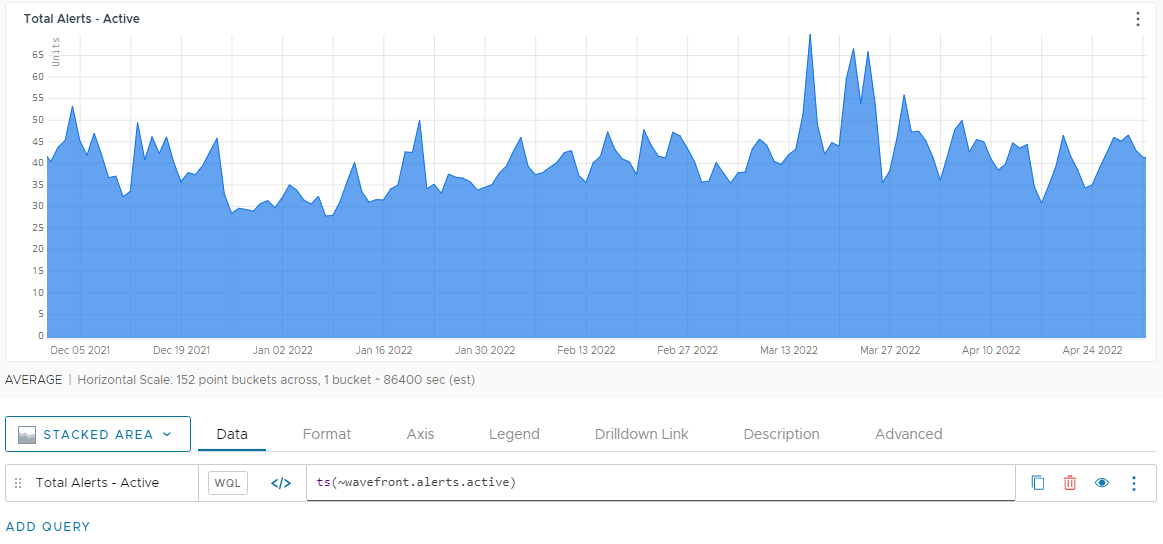
-
The active alerts can be further refined into different severity levels by using the
~wavefront.alerts.active_*metric.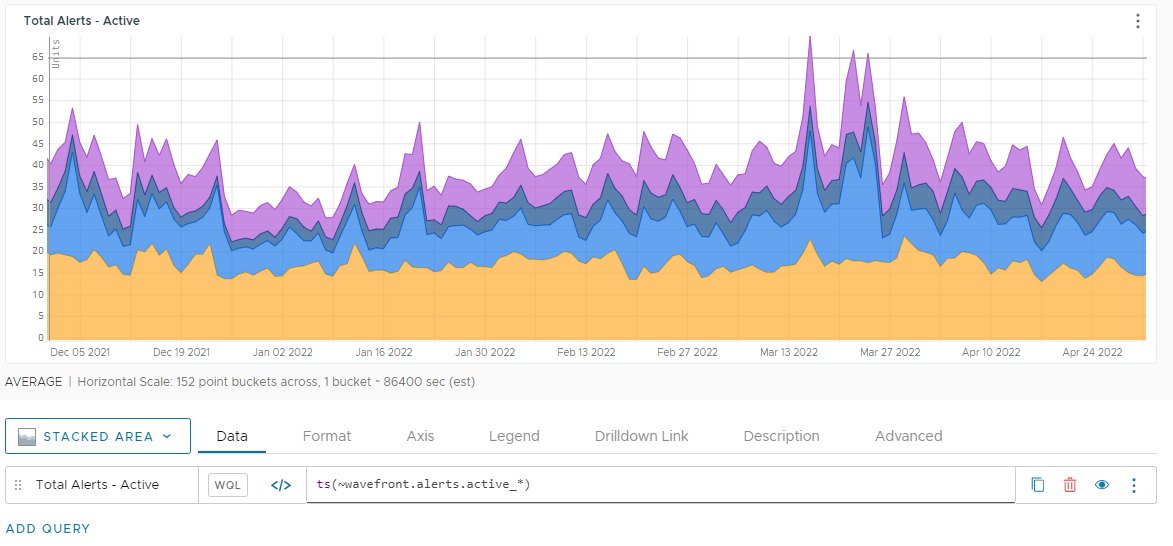
Track the Number of Active Operations for Applications Users
As a Super Admin user, you want better statistics on Operations for Applications adoption. The internal metrics provide you with not only the total number of users that have adopted the platform but also statistics around the weekly active users and monthly active users.
The user activity metrics accessed through the ~wavefront.users namespace show you your weekly active users, your monthly active users, and the total number of users. When analyzed over long periods, they can show you your most active (or least active) days, weeks, or months.
The namespaces to access these statistics are as follows:
~wavefront.users.total– Total users.~wavefront.users.active.7day– Weekly active users.~wavefront.users.active.30day– Monthly active users.
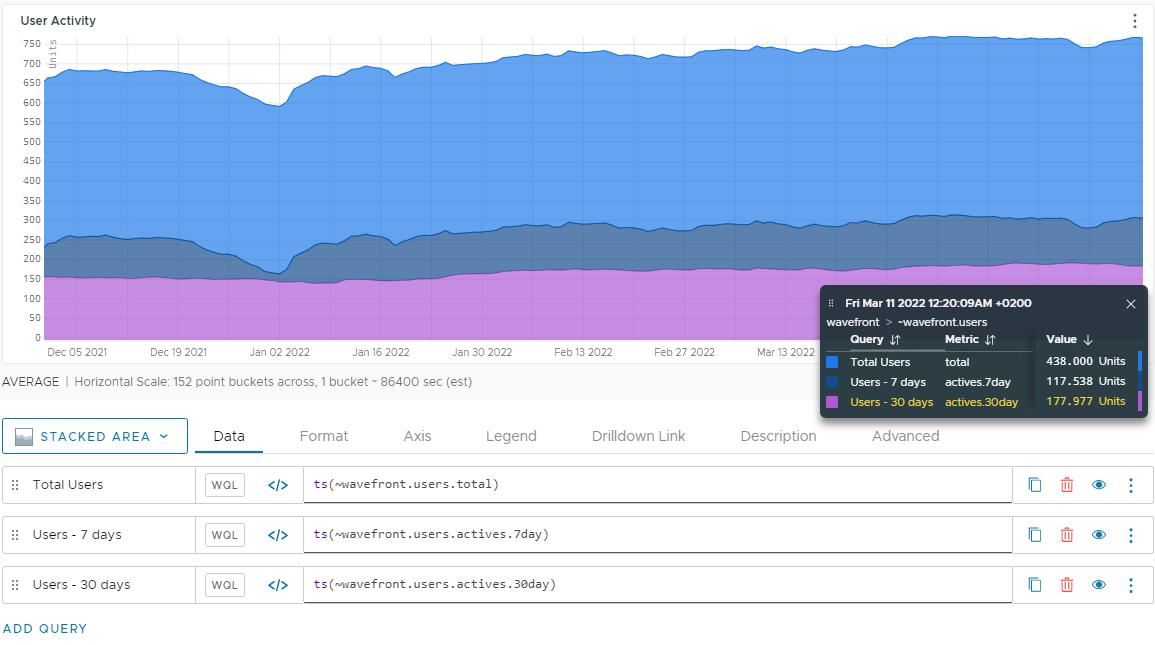
These statistics provide you with an understanding of how active your users are and the peak periods, if any, when users access Operations for Applications.
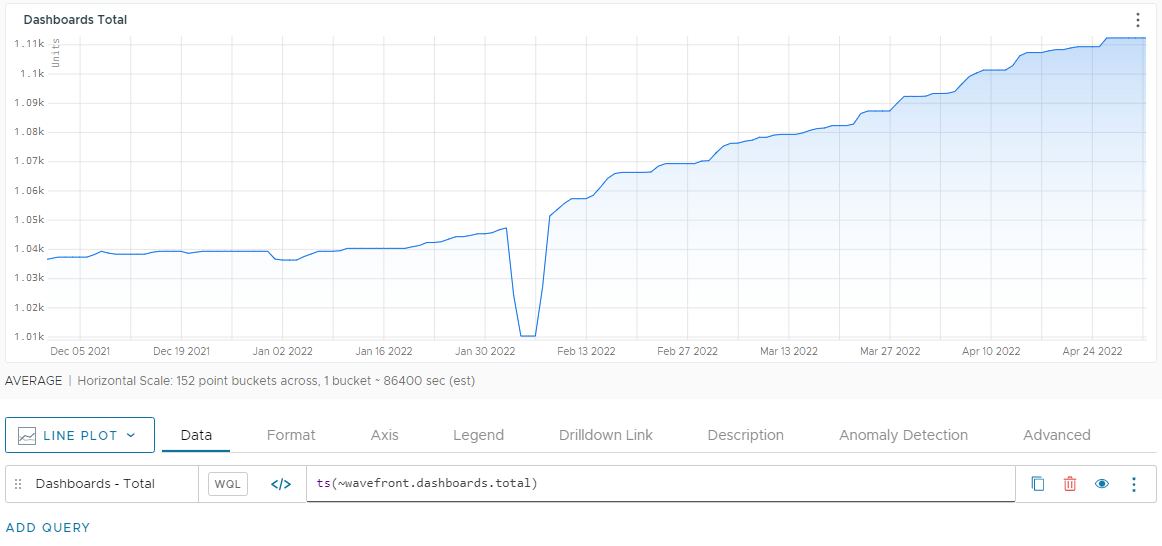
Track Dashboards Usage and Popularity
Dashboards are an excellent way of visualizing your data by collecting different charts in a single place. As new applications and services are launched, users often create new dashboards per their need to visualize their metrics in a single place. However, the user needs change over time, and sometimes new dashboards are created without deleting the dashboards that are no longer needed. While there is no limit for creating additional dashboards, the dashboards can overpopulate your dashboard organizer with a list of dashboards that are no longer in use.
Operations for Applications provides metrics not only on the total number of dashboards but also the number of times a particular dashboard has been accessed in the past and exact date and time it was accessed. For details, see Identify Unused Dashboards.
To access these statistics simply create charts with the ~wavefront.dashboard.<dashboard_name>.views metric or ~wavefront.dashboard.*.views for all dashboards. To see the total number of dashboards for a certain period of time, create a chart with the ~wavefront.dashboard.total metric.
Examine Versions of Dashboards and Alerts
Operations for Applications stores details about the versions of each dashboard and alert. That means you have an audit trail of changes. When someone saves changes to a dashboard or alert, we create a new version and track the changes, including details about the change and the user who made the change. If you suspect that someone has made changes to a dashboard which results in higher usage, you can check who made the change and what has changed.
You can examine dashboard and alert versions from the UI or using the REST API.
To examine versions of a dashboard:
- Select Browse > All Dashboards.
- Click the three vertical dots to the left of the dashboard you’re interested in and select Versions.
- You can review the changes to the dashboard, revert to a previous version, or clone a previous version.
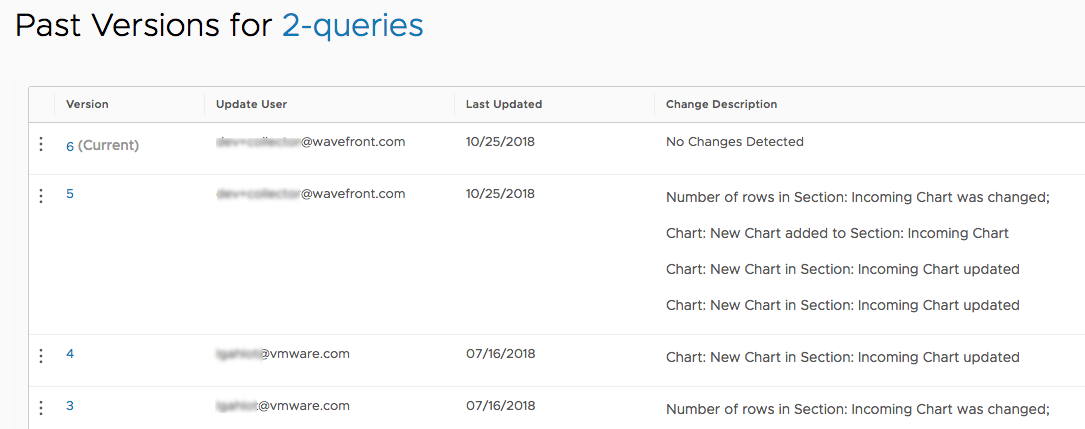
The process is the same for alerts.
Learn More!
- Find Actionable Usage Information explains how to use tools and dashboards to learn how much data is coming in, who is sending the data, how to get alerted if ingested data get close to monthly contracted usage, and how to optimize your ingestion rate.
- Operations for Applications Stats and Alert Stats explains the charts included in the Operations for Applications Stats and Alert Stats sections of the Operations for Applications Service and Proxy Data dashboard.