Users with access to the logs settings can map metrics tags to logs tags, traces tags to logs tags, and customize the time window you see on a chart or Traces Browser when you drill into logs from a chart and trace.
- For VMware Cloud services subscriptions, only users with the Super Admin service role in Super Admin mode can customize the logs settings.
- For original Operations for Applications subscriptions, users with the Accounts permission can customize the logs settings.
Map Tags
When you are on a chart, application map, or in the Traces Browser, and drill into the Logs Browser, the tags associated with the metrics or trace are added as search filters to the Logs Browser. If the logs tags are different from the metrics or traces tags, you don’t see logs on the Logs Browser. Therefore, it is important that you use the same tags for metrics, traces, and logs.
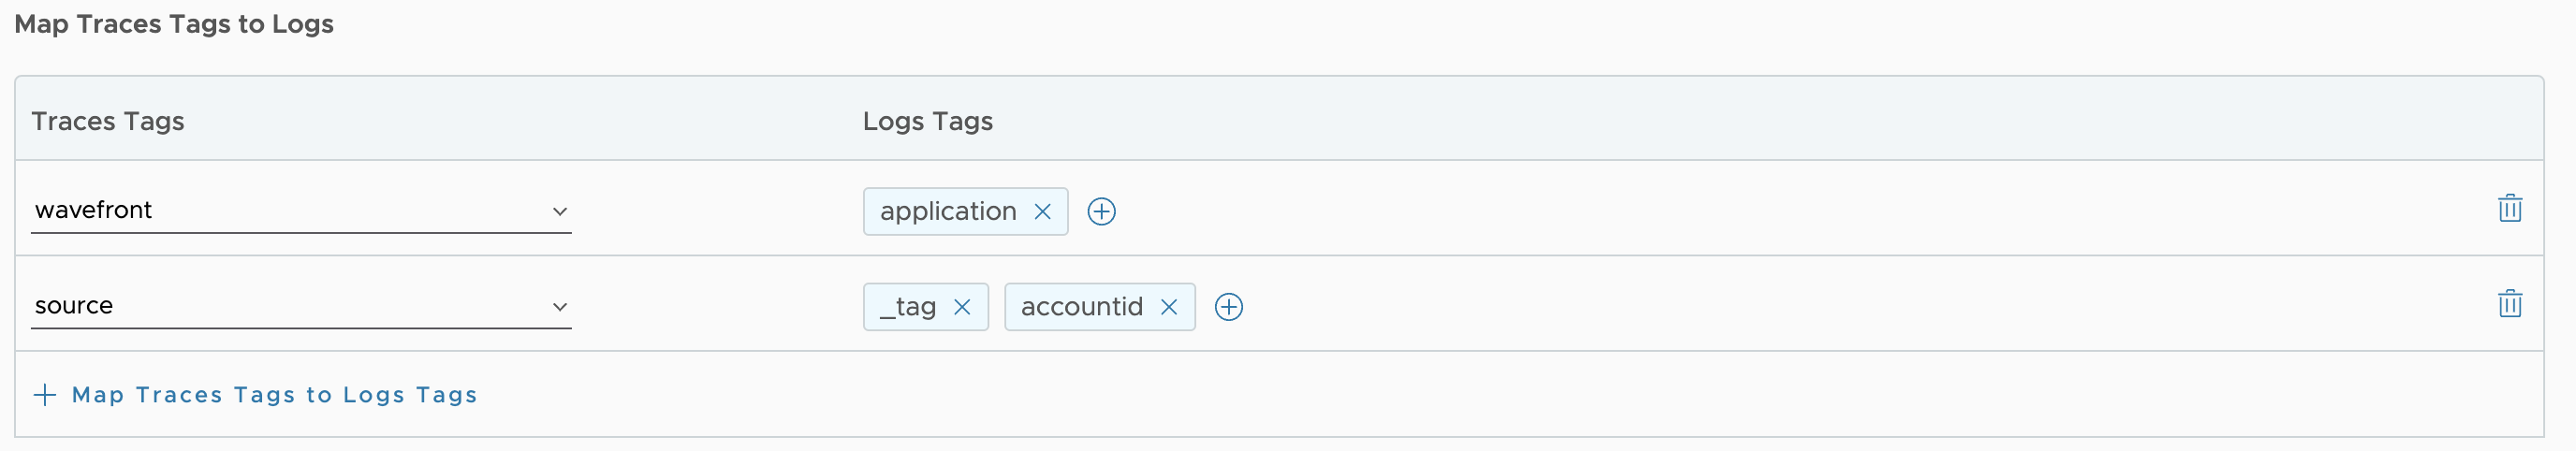
Map the Traces Tags to Logs Tags
If your traces and logs use different tags, follow these steps to create a map between the tags:
- From the gear icon on the toolbar, select Organization Settings.
- Click Map Traces Tags to Log Tags.
- Select the trace tags you want to map from the drop-down list.
- Click Choose tags and select the tag you want to map with the trace tag.
- Click Save.
Example:
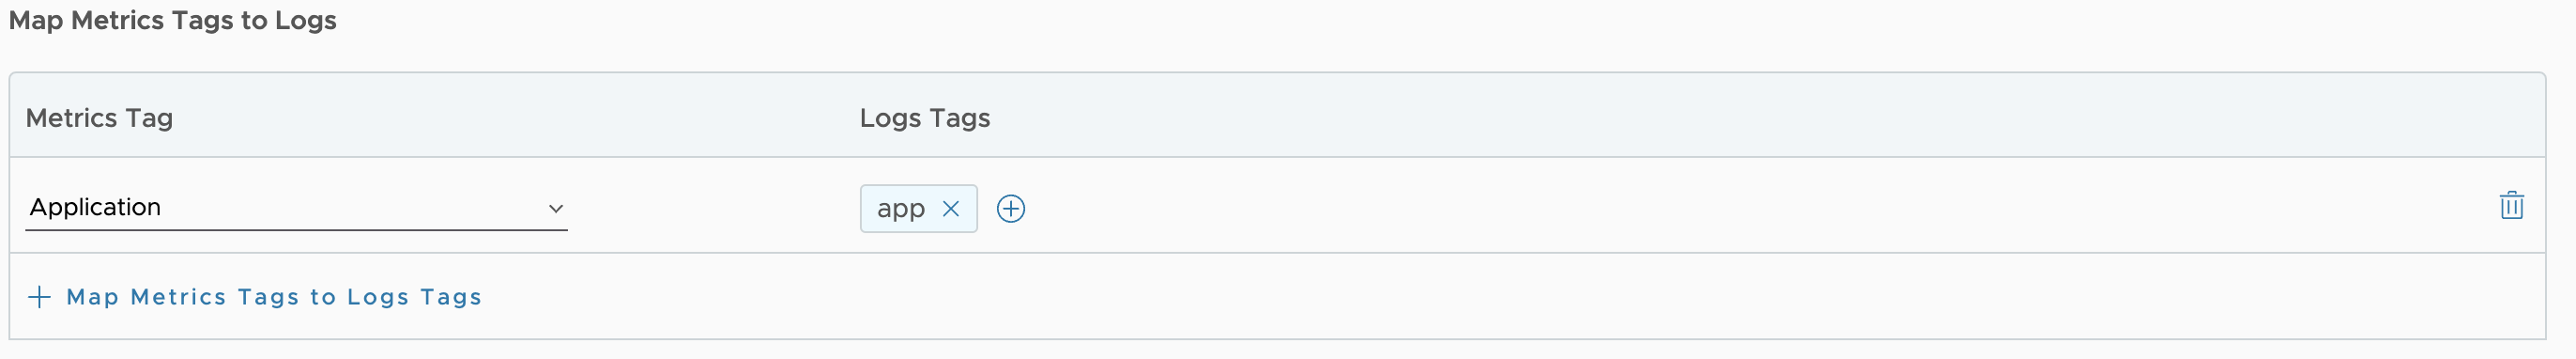
Map the Metric Tags to Logs Tags
If your metrics and logs use different tags, follow these steps to create a map between the tags:
- From the gear icon on the toolbar, select Organization Settings.
- Click Map Metrics Tags to Log Tags.
- Select the metrics tags you want to map from the drop-down list.
- Click Choose tags and select the tag you want to map with the trace tag.
- Click Save.
Example:
Customize the Time Window when Drilling into Logs
When you drill into logs from a chart or trace, we get the timestamp of the data from the chart or trace and add a default buffer time before and after the timestamp to create a time window in the Logs Browser.
- For charts, our service adds a 5-minute buffer time before and after the timestamp of the data you want to see.
For example, if you right-click in a chart at 5.00 PM and click Go To Logs, the time window of the Logs Browser is set from 4.45 PM to 5.05 PM.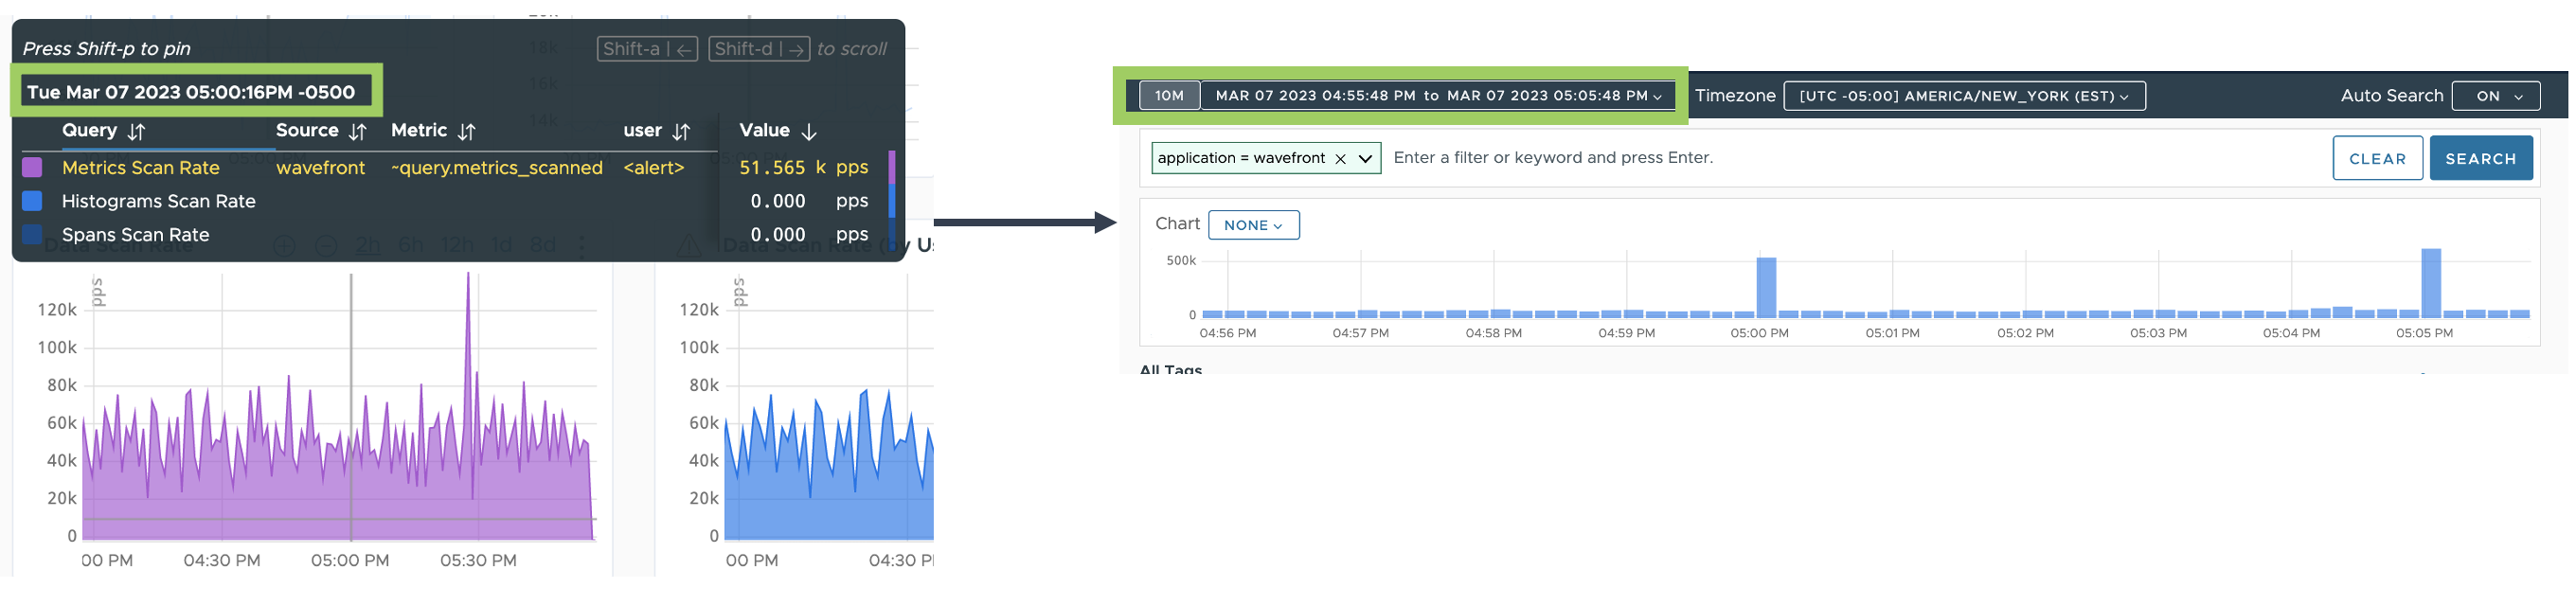
- For traces, your administrator can configure a default buffer time. If there is no default buffer time, our service adds a 5-second buffer time before and after the timestamp and the duration of a trace.
For example, if the trace is created at 2.09.40 PM and the duration of the trace is approximately 1 second, when you click Search Logs on the Traces Browser, the time window on the Logs Browser is set from 2.09.45 PM to 2.09.45 PM (5 seconds before trace timestamp + trace duration + 5 seconds after trace timestamp).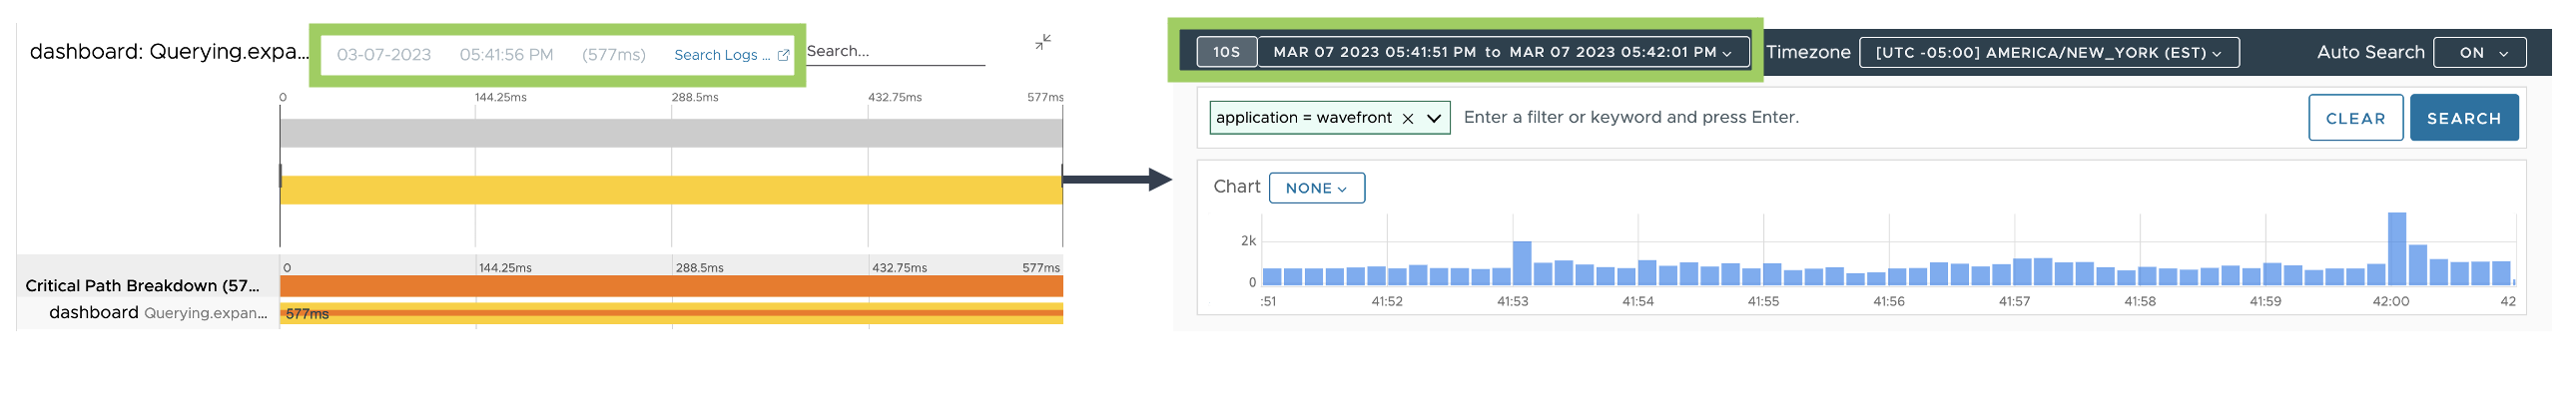
Follow these steps to change the default buffer times:
- From the gear icon on the toolbar, select Organization Settings.
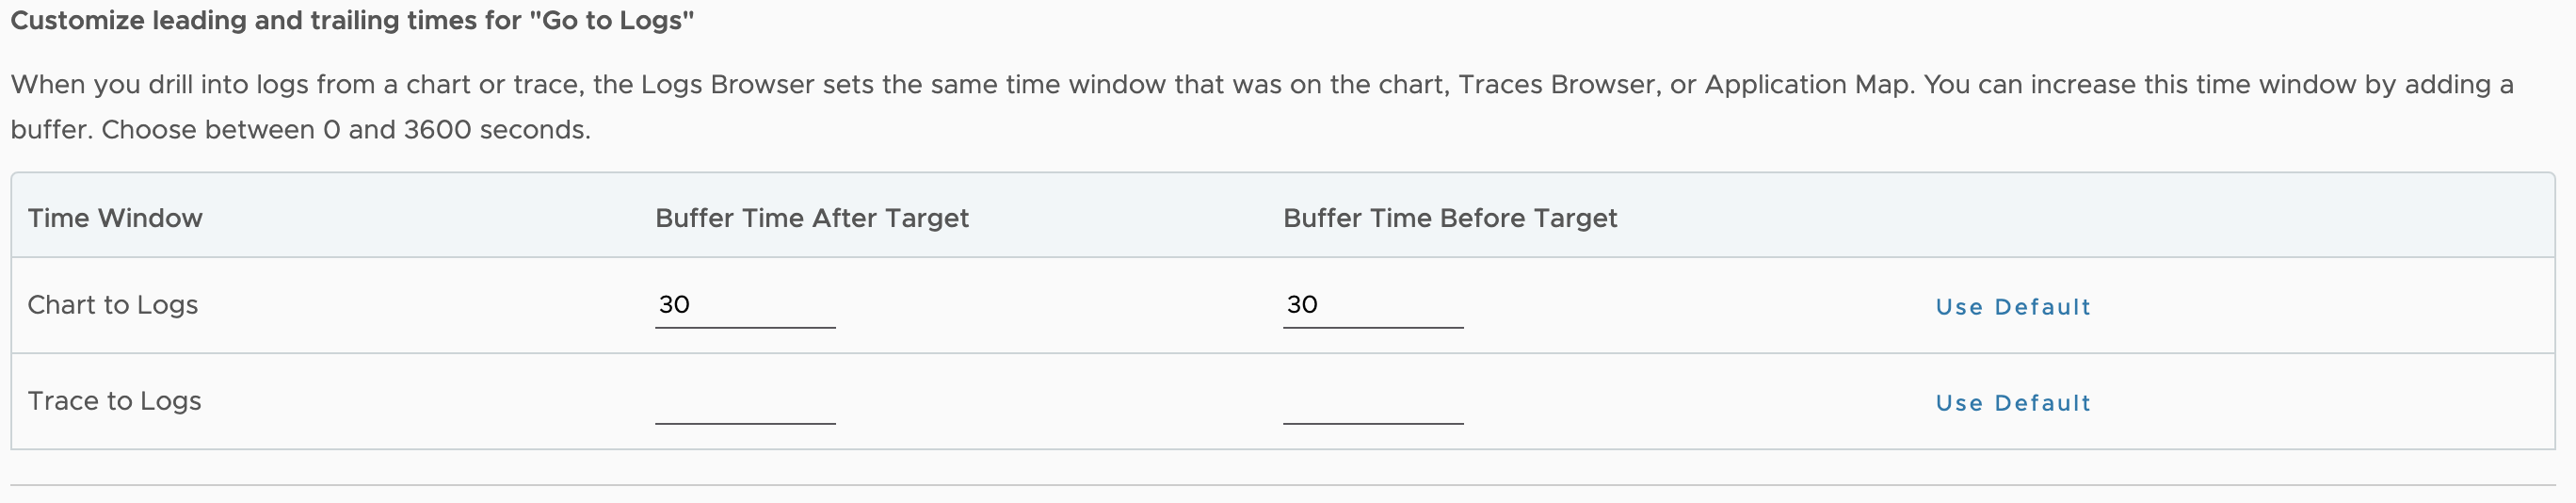
- Set the before and after buffer times under Customize leading and trailing times for “Go to Logs”. The values must be between 0 and 3600 seconds.
For example, create a 1 minute time window on the Logs Browser by adding a 30-second buffer time before and after the timestamp of the data on the chart: