Send OpenTelemetry traces and metrics data to VMware Aria Operations for Applications (formerly known as Tanzu Observability by Wavefront).
Sending Data to Our Service
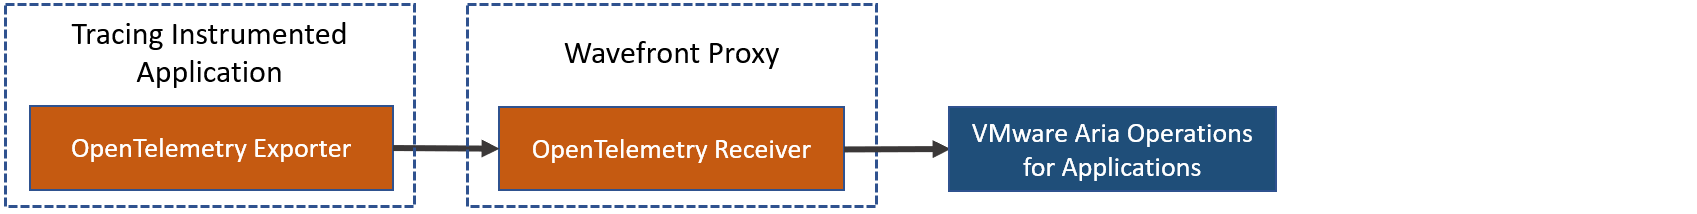
If you use OpenTelemetry, you can configure the application to send traces or metrics to VMware Aria Operations for Applications (formerly known as Tanzu Observability by Wavefront) using the Wavefront proxy.
Configure the Wavefront Proxy
- Install the Wavefront proxy.
- Configure the Wavefront proxy to send OpenTelemetry data to our service. See the Wavefront proxy settings for OpenTelemetry.
- Trace data: Port 4317 (recommended) with
otlpGrpcListenerPortsor port 4318 (recommended) withotlpHttpListenerPorts. - Metrics data:
- Port 4317 (recommended) with
otlpGrpcListenerPortsor port 4318 (recommended) withotlpHttpListenerPorts. - To receive the OpenTelemetry resource attributes that your application sends for metrics data, set
otlpResourceAttrsOnMetricsIncludedtotrue.
Note: Be aware that setting this totrueincreases the chance of metrics exceeding the annotations count limit on your cluster, causing the metrics to be dropped by the Wavefront proxy.
- Trace data: Port 4317 (recommended) with
Send and View Data
Follow these steps to send traces or metrics to our service:
- Configure your application to send trace data to the Wavefront proxy.
By default, OpenTelemetry SDKs send data over gRPC tohttp://localhost:4317. - Explore trace and metrics data:
- Trace data:
You can use our tracing dashboards to visualize the requests as traces, which consists of a hierarchy of spans. This visualization helps you pinpoint where the request is spending most of its time and discover problems. - Metrics data:
Explore the metrics data you sent with charts and dashboards.- Try out the Dashboards and Charts tutorial, or watch the video on that page to get started.
- Create dashboards and charts using the data you sent to our service.
You need to have the required permissions to do these tasks.
- Trace data:
Metrics Conversion
The OpenTelemetry metrics your applications send are converted to our data format as follows:
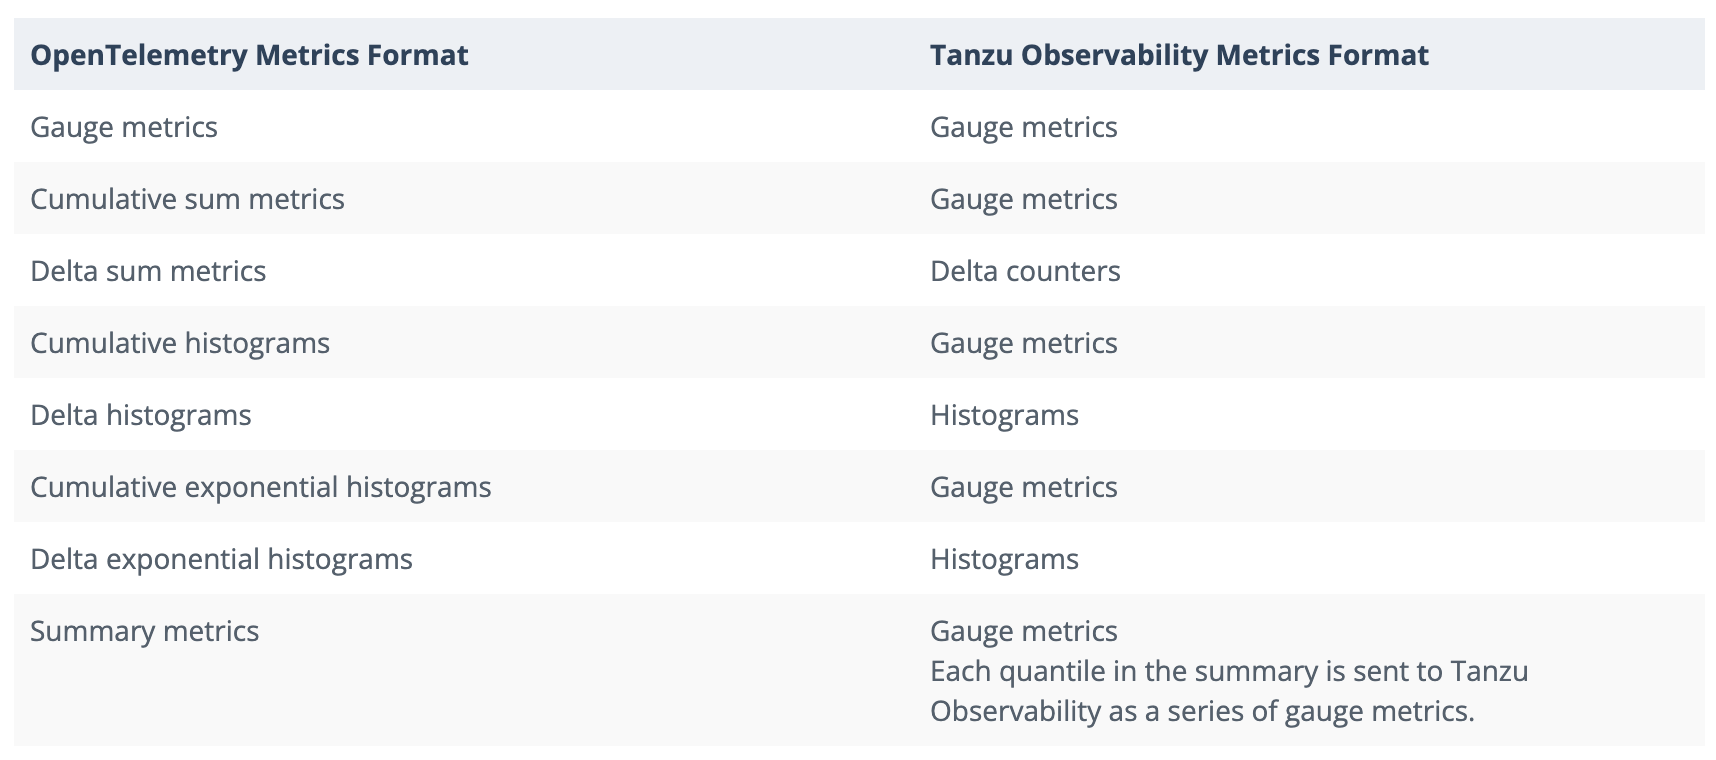
For more information on our metrics, see Metric Types.
Tutorials
Our OpenTelemetry GitHub repository includes specific examples for Java, Python, .NET, and more.
- If you are on our Documentation, expand the tutorials section under OpenTelemetry, and try out a tutorial.
- If you are on the GitHub repository, for example, go to the
java-examplesfolder and follow the steps in the README to instrument Java Apps with OpenTelemetry.
Getting Support
- If you run into any issues with the examples, let us know by creating a GitHub issue on our OpenTelemetry GitHub repository.
- If you didn’t find the information you are looking for in our Documentation, create a GitHub issue or PR in our docs repository.