Monitor your Kubernetes environment at the infrastructure level and at the applications level with our Kubernetes Metrics Collector.
- Monitor Kubernetes infrastructure metrics (containers, pods, etc.) from our dashboards – and create alerts from those dashboards.
- Automatically collect metrics from applications and workloads using built-in plug-ins such as Prometheus, Telegraf, etc.
Scale your Kubernetes environment based on the metrics sent to VMware Aria Operations for Applications with our Horizontal Pod Autoscaler Adapter.
Videos
The following videos get you started.
| Observability for Kubernetes Operator (August 2022) |
This video is about recent changes to the install process and shows a demo. You can then get started by going to the following GitHub pages: You can also watch the video here |
| Observability and Kubernetes (January 2020) |
This video includes some details on the one-click install of the Kubernetes Metrics Collector. You can also watch the video here |
| Monitor and Scale Kubernetes (August 2019) |
This video gives you the big picture. It explains the different ways of monitoring Kubernetes with Operations for Applications. You can also watch the video here |

Send Data from Your Kubernetes Environment
You can send data to VMware Aria Operations for Applications in several ways:
-
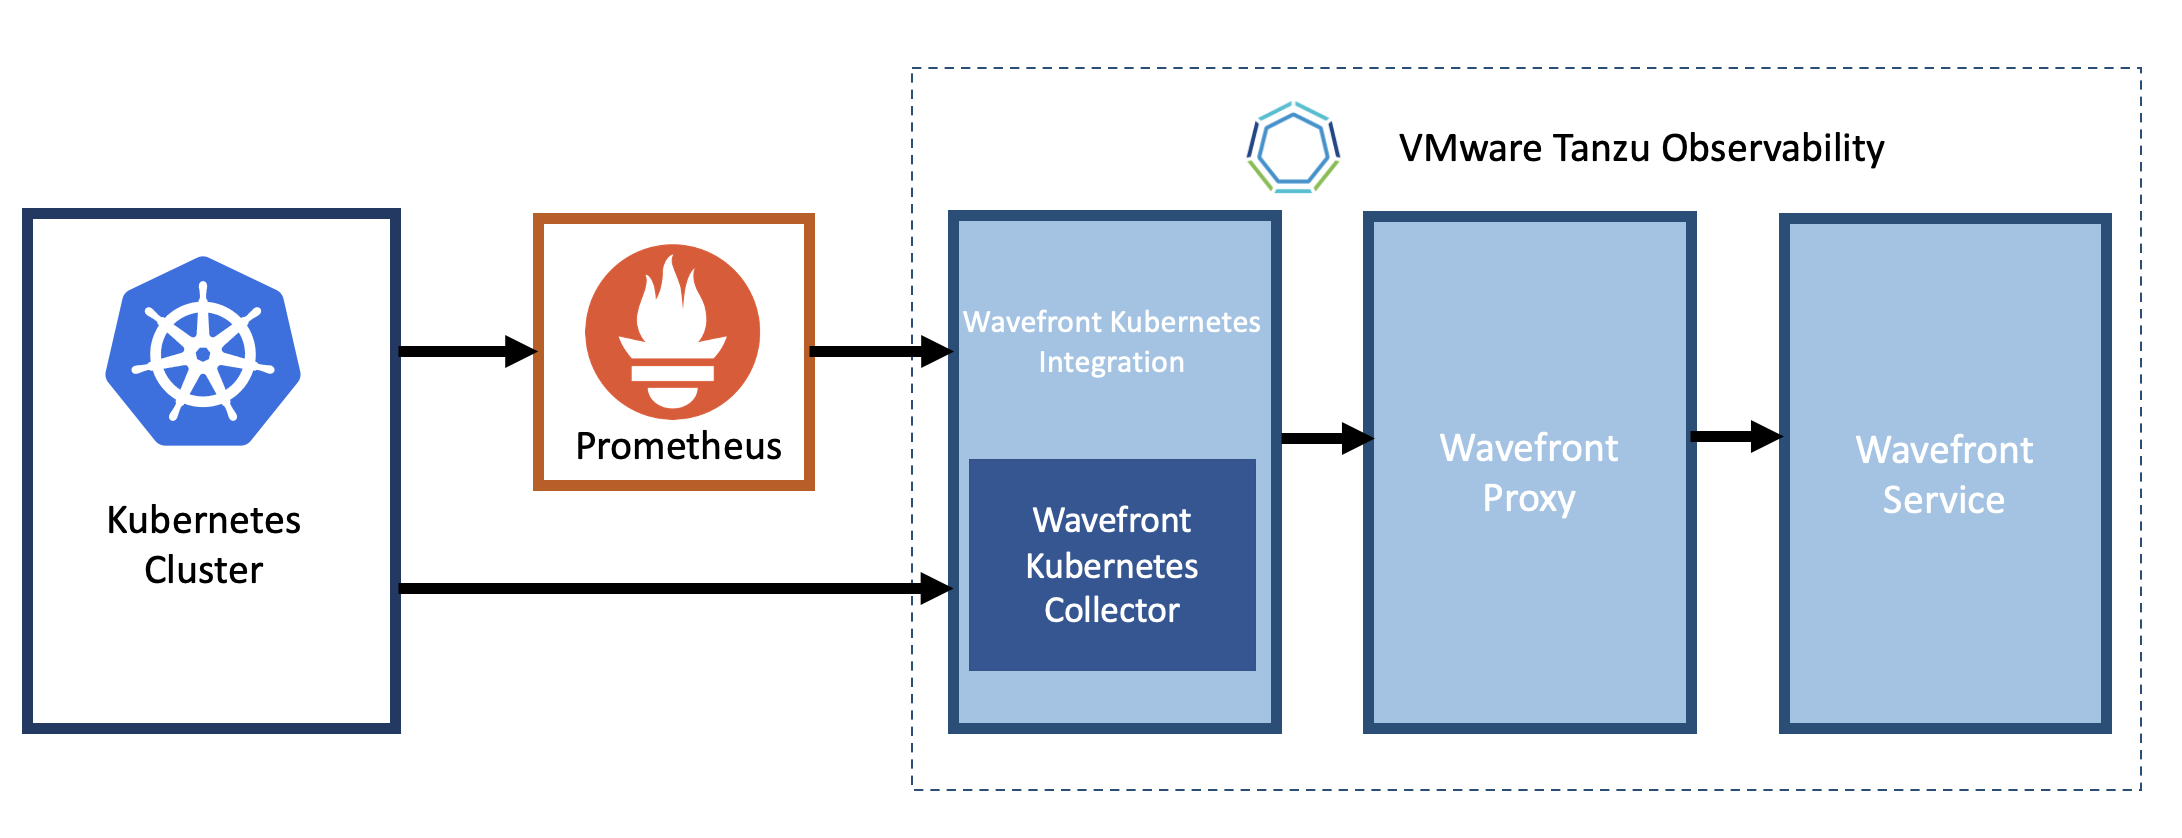
Direct: Use our Kubernetes Metrics Collector to send data directly from your Kubernetes cluster to the Wavefront proxy. The Collector can collect metrics from Prometheus compatible applications and support a number of Telegraf plugins.
-
Prometheus: If you are already using Prometheus to view your data and want to monitor your Kubernetes data with VMware Aria Operations for Applications, send data to the Kubernetes Metrics Collector.
To use our Kubernetes Metrics Collector, you must set up our Kubernetes integration. Use one of the following options:
-
[Recommended] Directly by using the VMware Aria Operations for Applications user interface.
The new Observability for Kubernetes Operator supports deploying the Collector and the Wavefront proxy in Kubernetes with a few clicks.
- Log in to your product instance and click Integrations on the toolbar.
- In the Featured section, click the Kubernetes integration tile.
- On the Setup tab, click Add Integration.
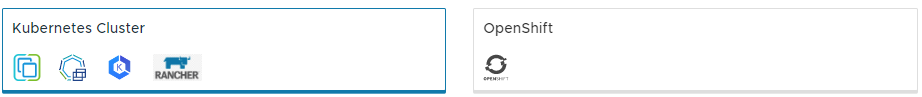
- Set up the integration in a Kubernetes cluster or OpenShift. You can preview the setup steps here.
-
Follow the guidelines given in the Bitnami guide.
Monitor Kubernetes
Our Kubernetes Metrics Collector supports monitoring for your Kubernetes infrastructure at all levels of the stack. See the list of metrics collected by the Kubernetes Metrics Collector.
- Set up the Kubernetes Collector to have much of the monitoring happen automatically.
- Fine-tune and customize the solution with configuration options available in the Operations for Applications Kubernetes Metrics Collector.
kubernetes. metrics namespace from persistent to ephemeral. For details, see Change the Retention Period of Metrics.Infrastructure Monitoring
Our Kubernetes Metrics Collector collects metrics to give comprehensive insight into all layers of your Kubernetes environment, such as nodes, pods, services, and config maps.
Depending on the selected setup, metrics are sent to the Wavefront proxy and from there to the VMware Aria Operations for Applications service. It’s possible to send metrics using direct ingestion, but the Wavefront proxy is preferred for most cases.
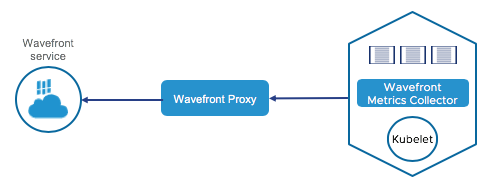
The collector runs as a DaemonSet for high scalability and supports leader election for monitoring cluster-level resources.
Host-Level Monitoring
The Kubernetes Metrics Collector supports automatic monitoring of host-level metrics and host-level systemd metrics. When you set up the collector, it auto-discovers pods and services in your environment and starts collecting host-level metrics.
You can filter the metrics before they are reported to the VMware Aria Operations for Applications service.
Application Monitoring
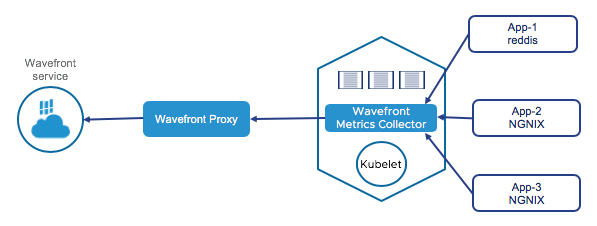
Our Kubernetes Metrics Collector automatically starts collecting metrics from many commonly used applications:
- The collector auto discovers endpoints using labels. See Auto Discovery.
- The collector also scrapes Prometheus metric endpoints such as API server,
etcd, and NGINX.
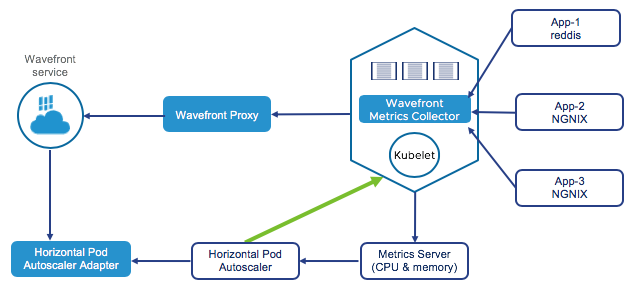
You can also configure the Collector to collect data from Telegraf application sources, such as Redis, RabbitMQ. etc., using the configuration.md file.
The following diagram illustrates this:
Visualize Kubernetes Data
One you set up the Kubernetes integration, you can use the out-of-the-box dashboards. To access these dashboards, you need to:
- Log in to your product instance and click Integrations on the toolbar.
- Search for Kubernetes and click the Kubernetes integration tile.
- Click the Dashboards tab.
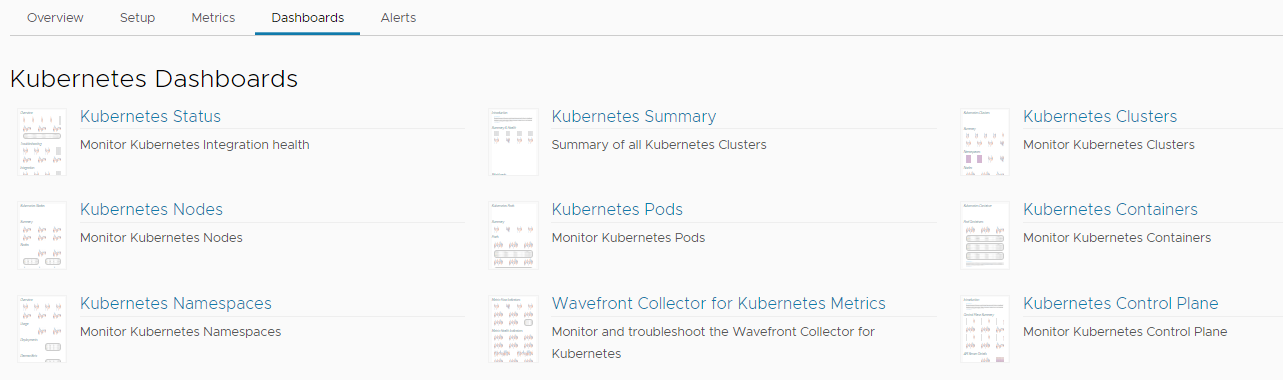
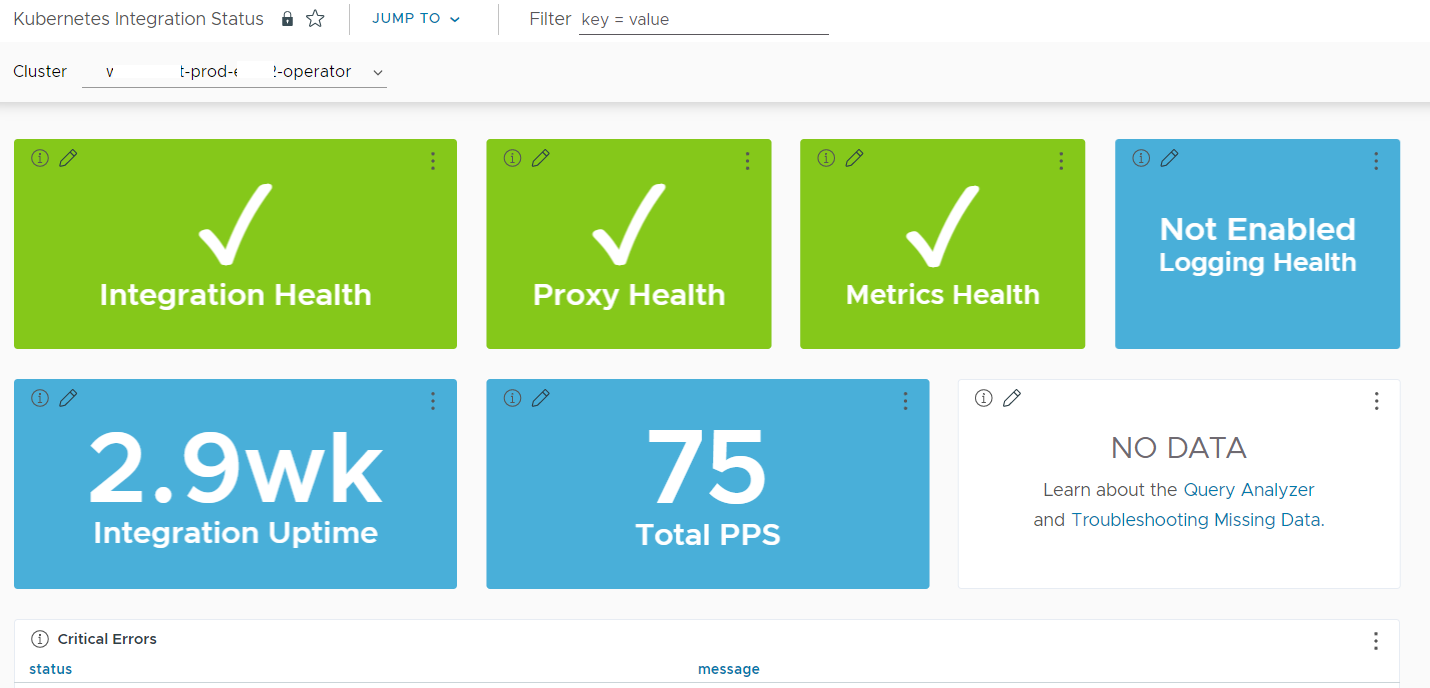
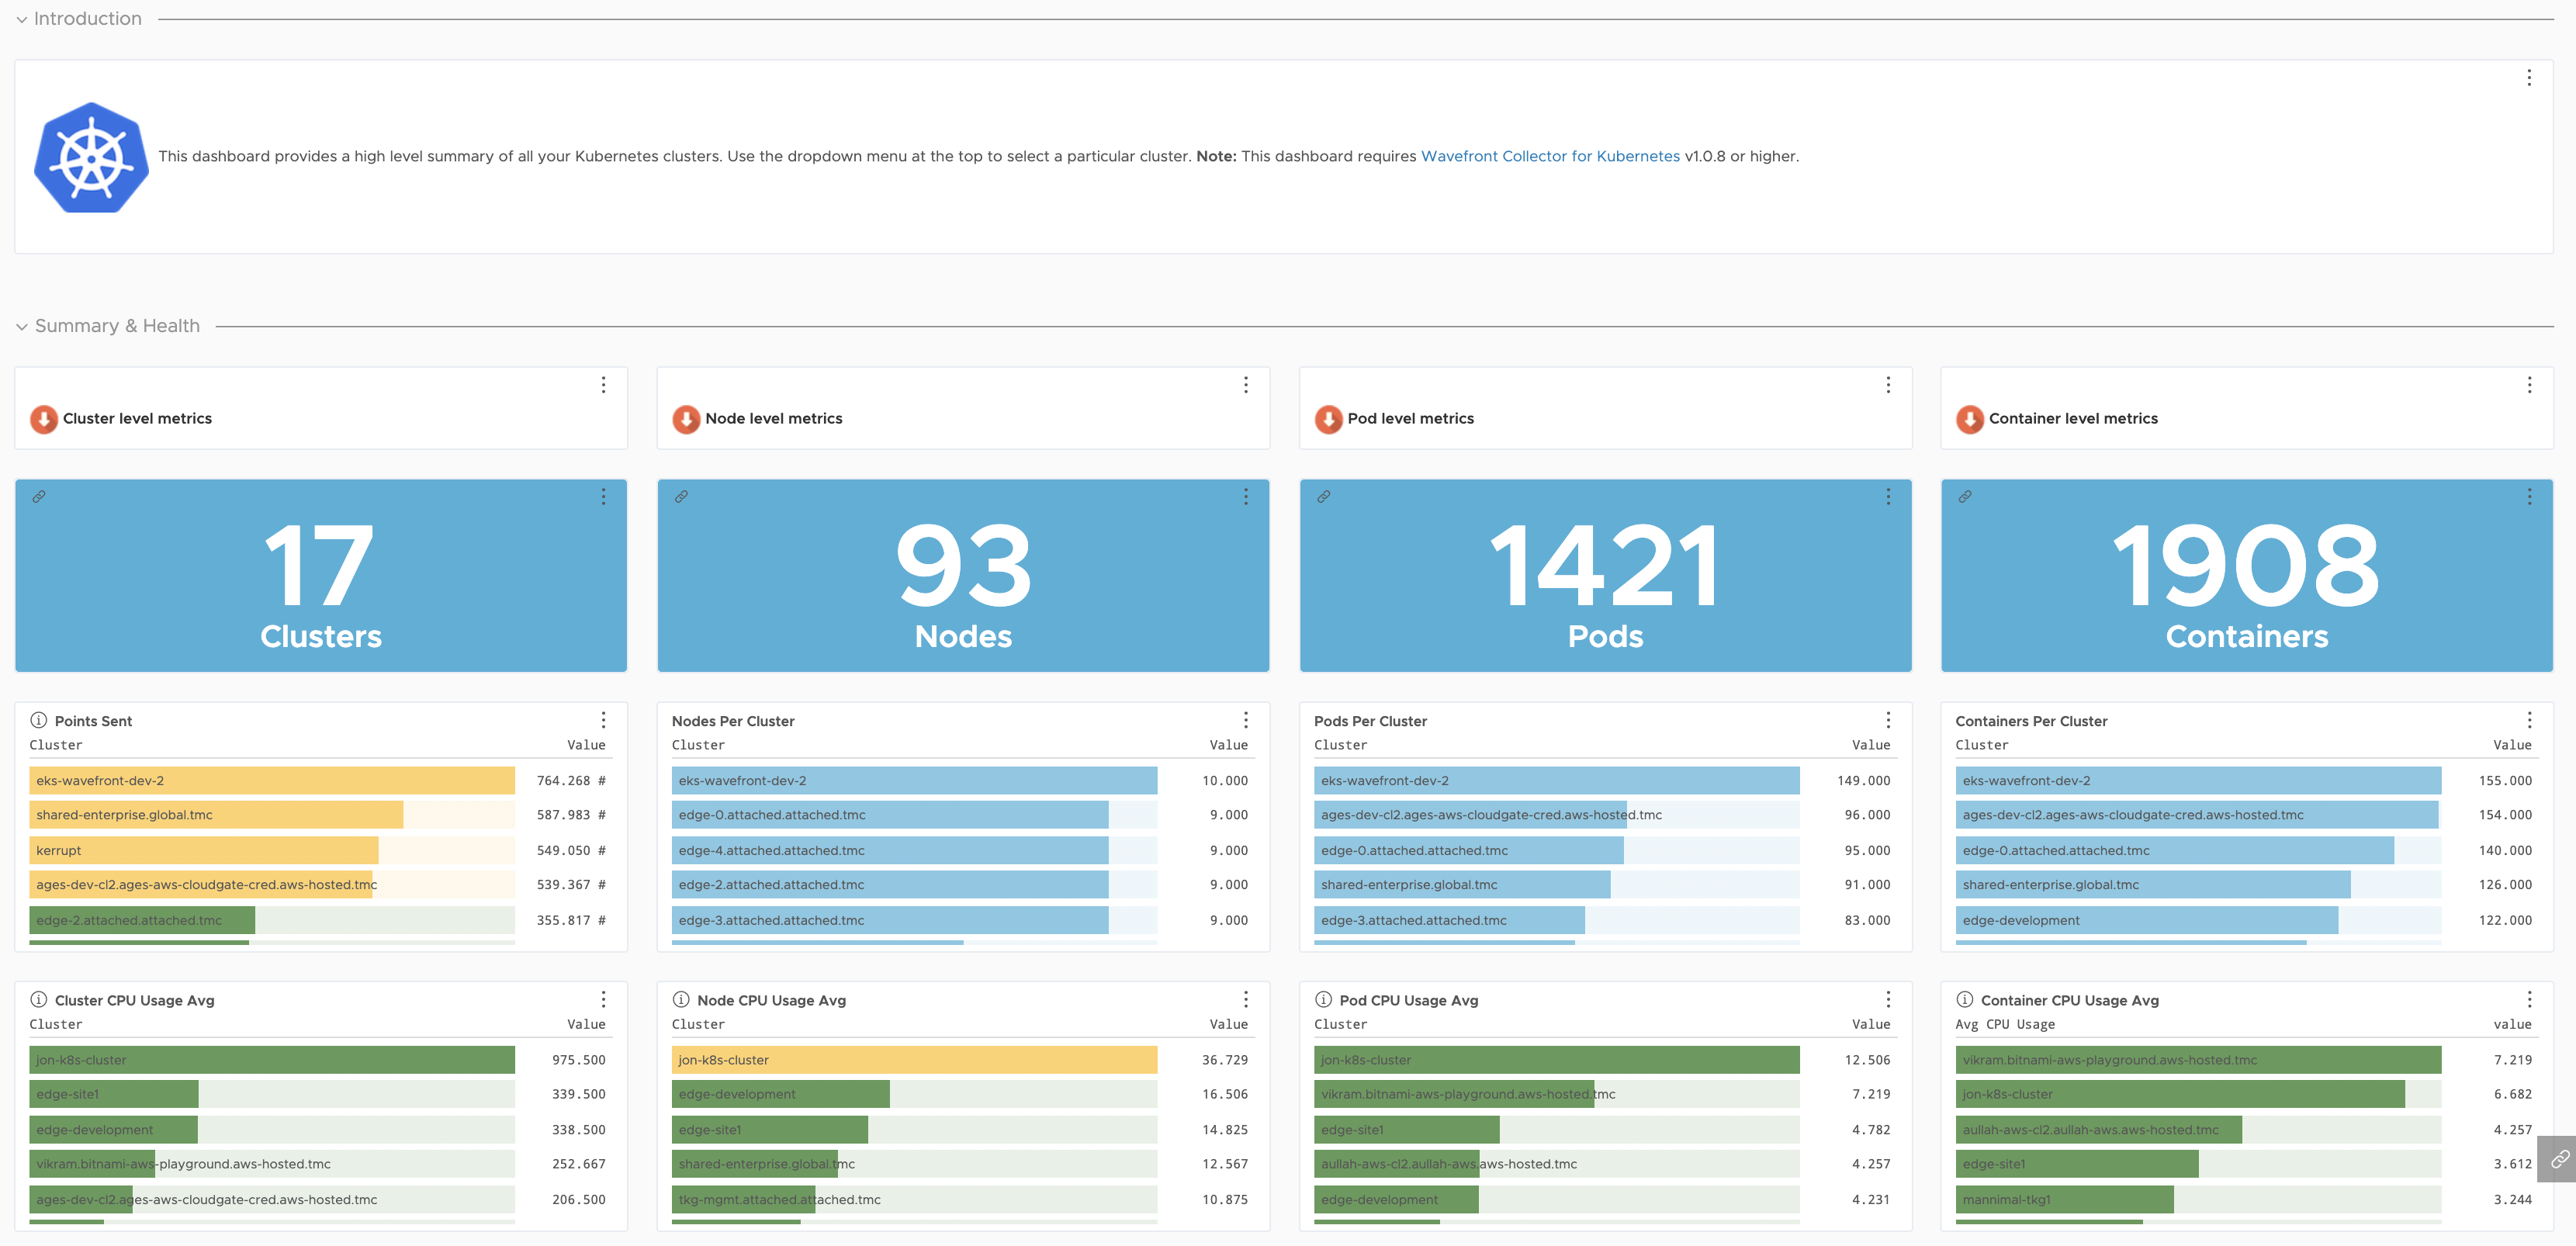
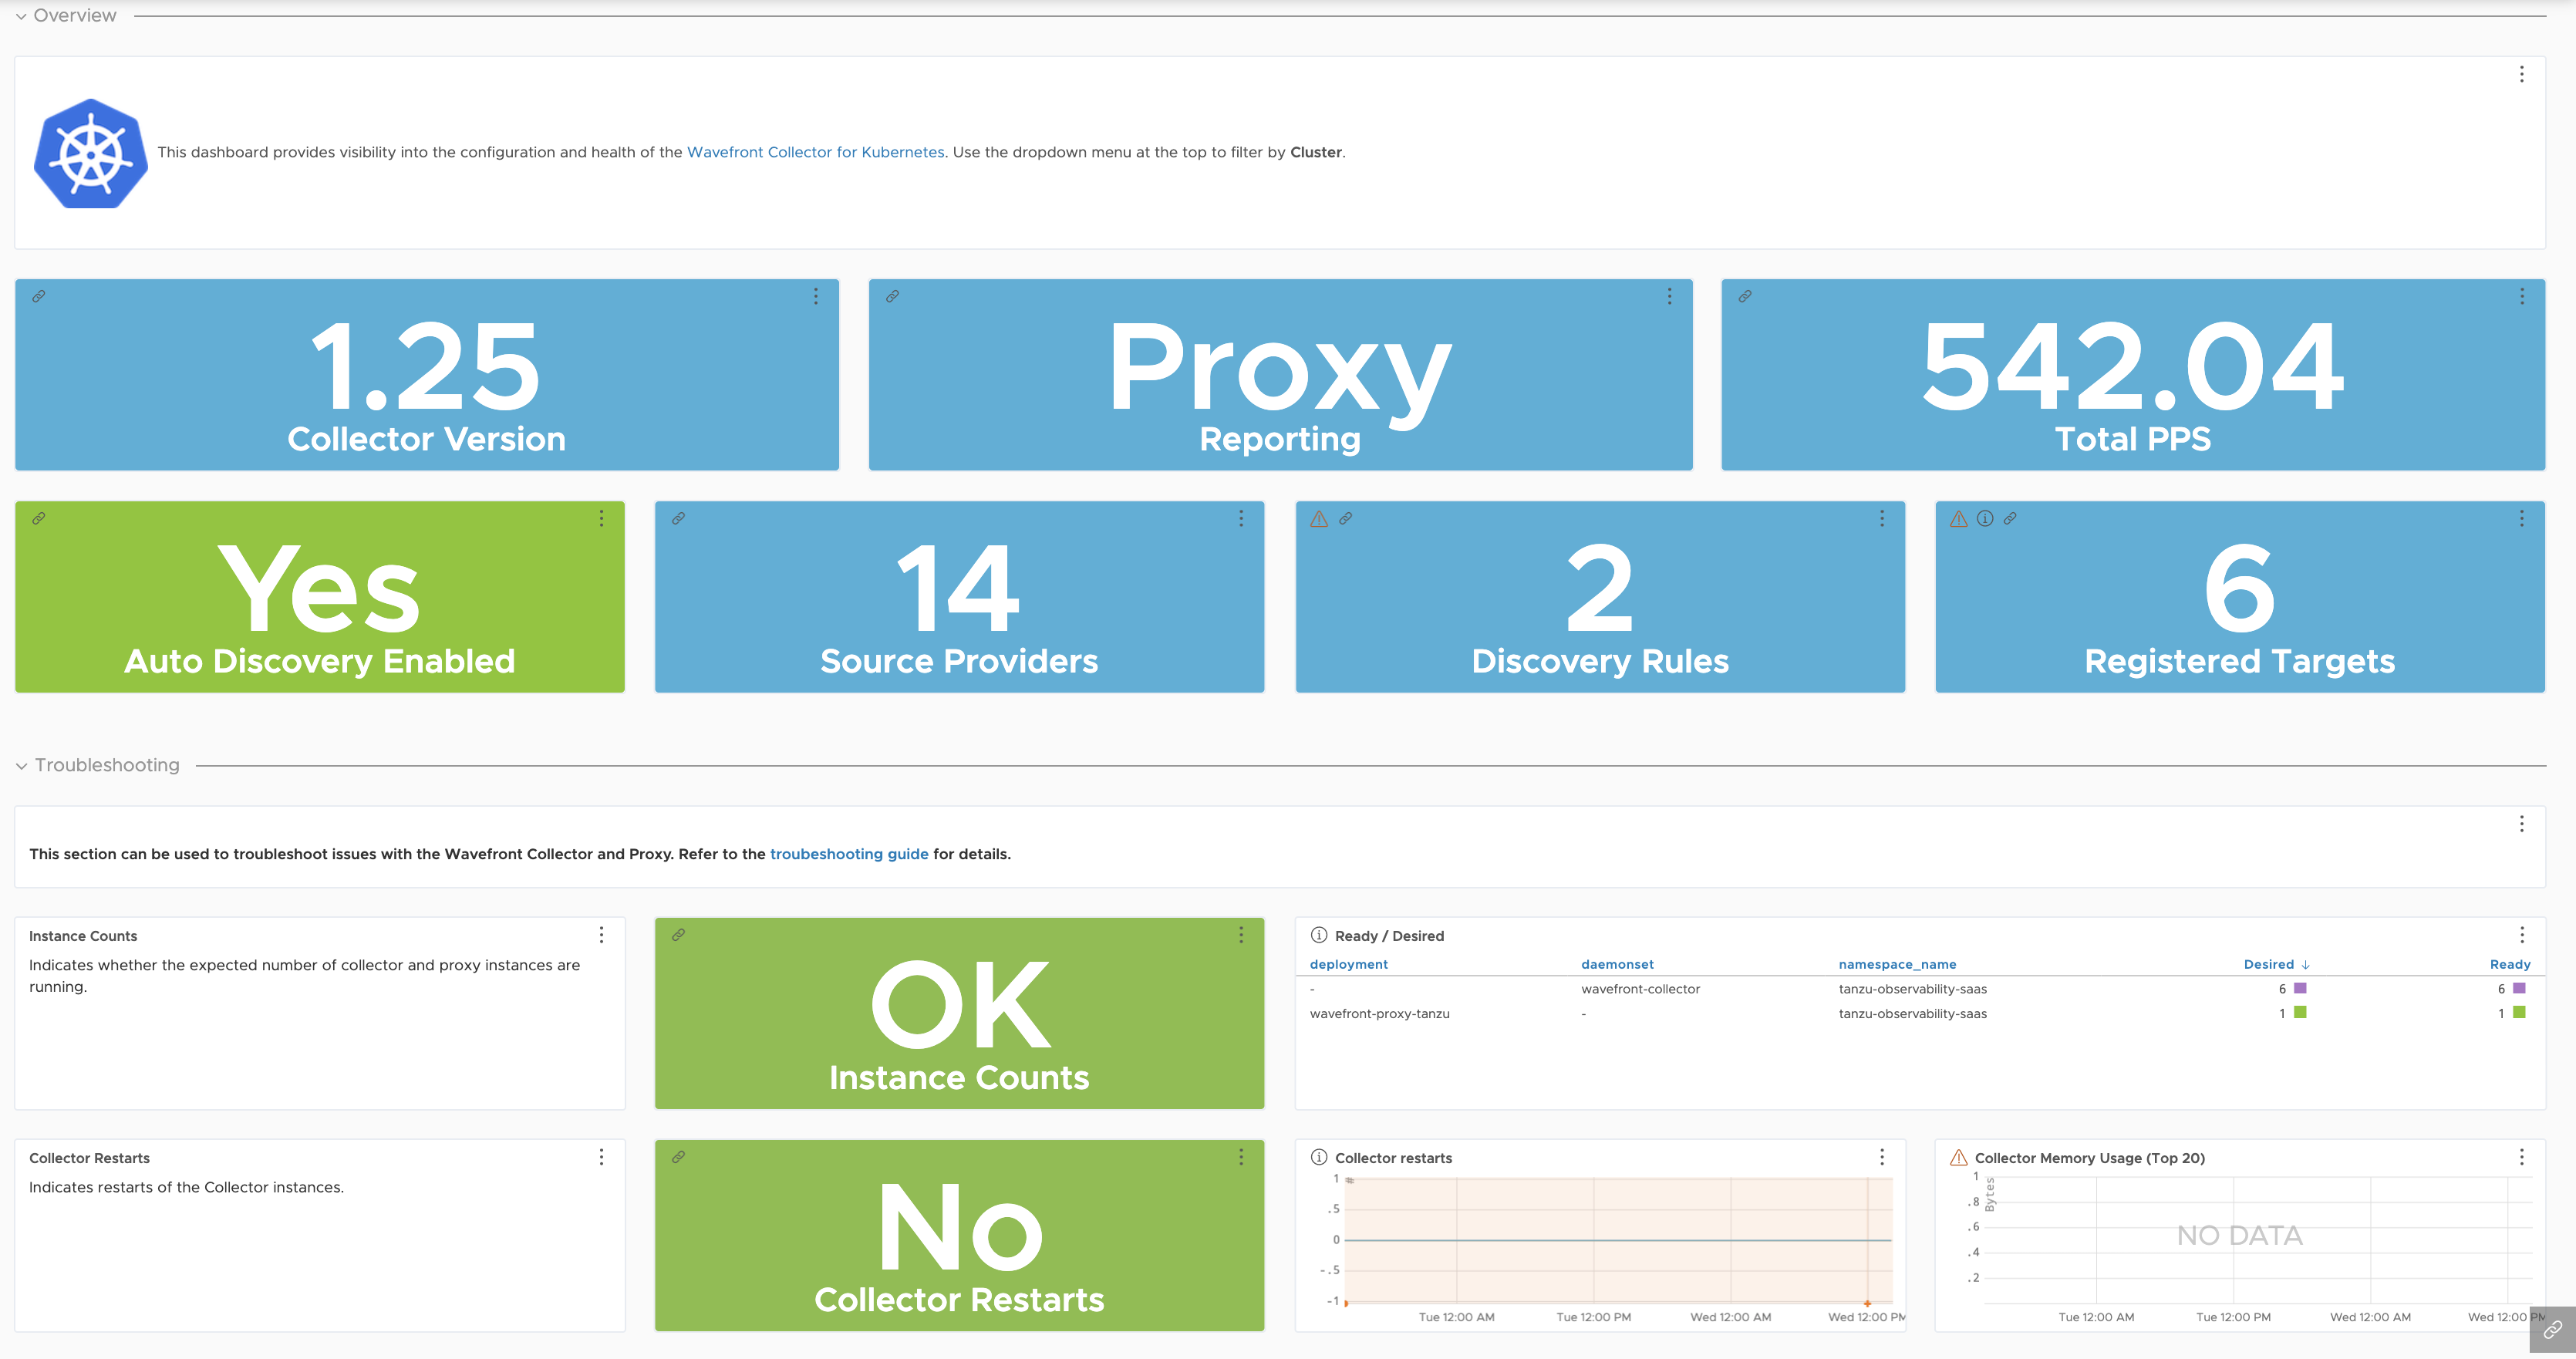
The Kubernetes Status dashboard gives details about the health of your integration. The Kubernetes Summary dashboard gives details on the health of your infrastructure and workloads. You can drill down from this dashboard and identify potential hotspots.
These out-of-the-box dashboards are read-only. To create a customizable copy:
- Open a dashboard, click the ellipsis icon in the top right, and select Clone.
- In the cloned dashboard, add your own charts or customize the RED metrics charts.
The out-of-the-box dashboards:
| Dashboard | Description |
|---|---|
| Kubernetes Status |
Details on the use of the Kubernetes Integration.
|
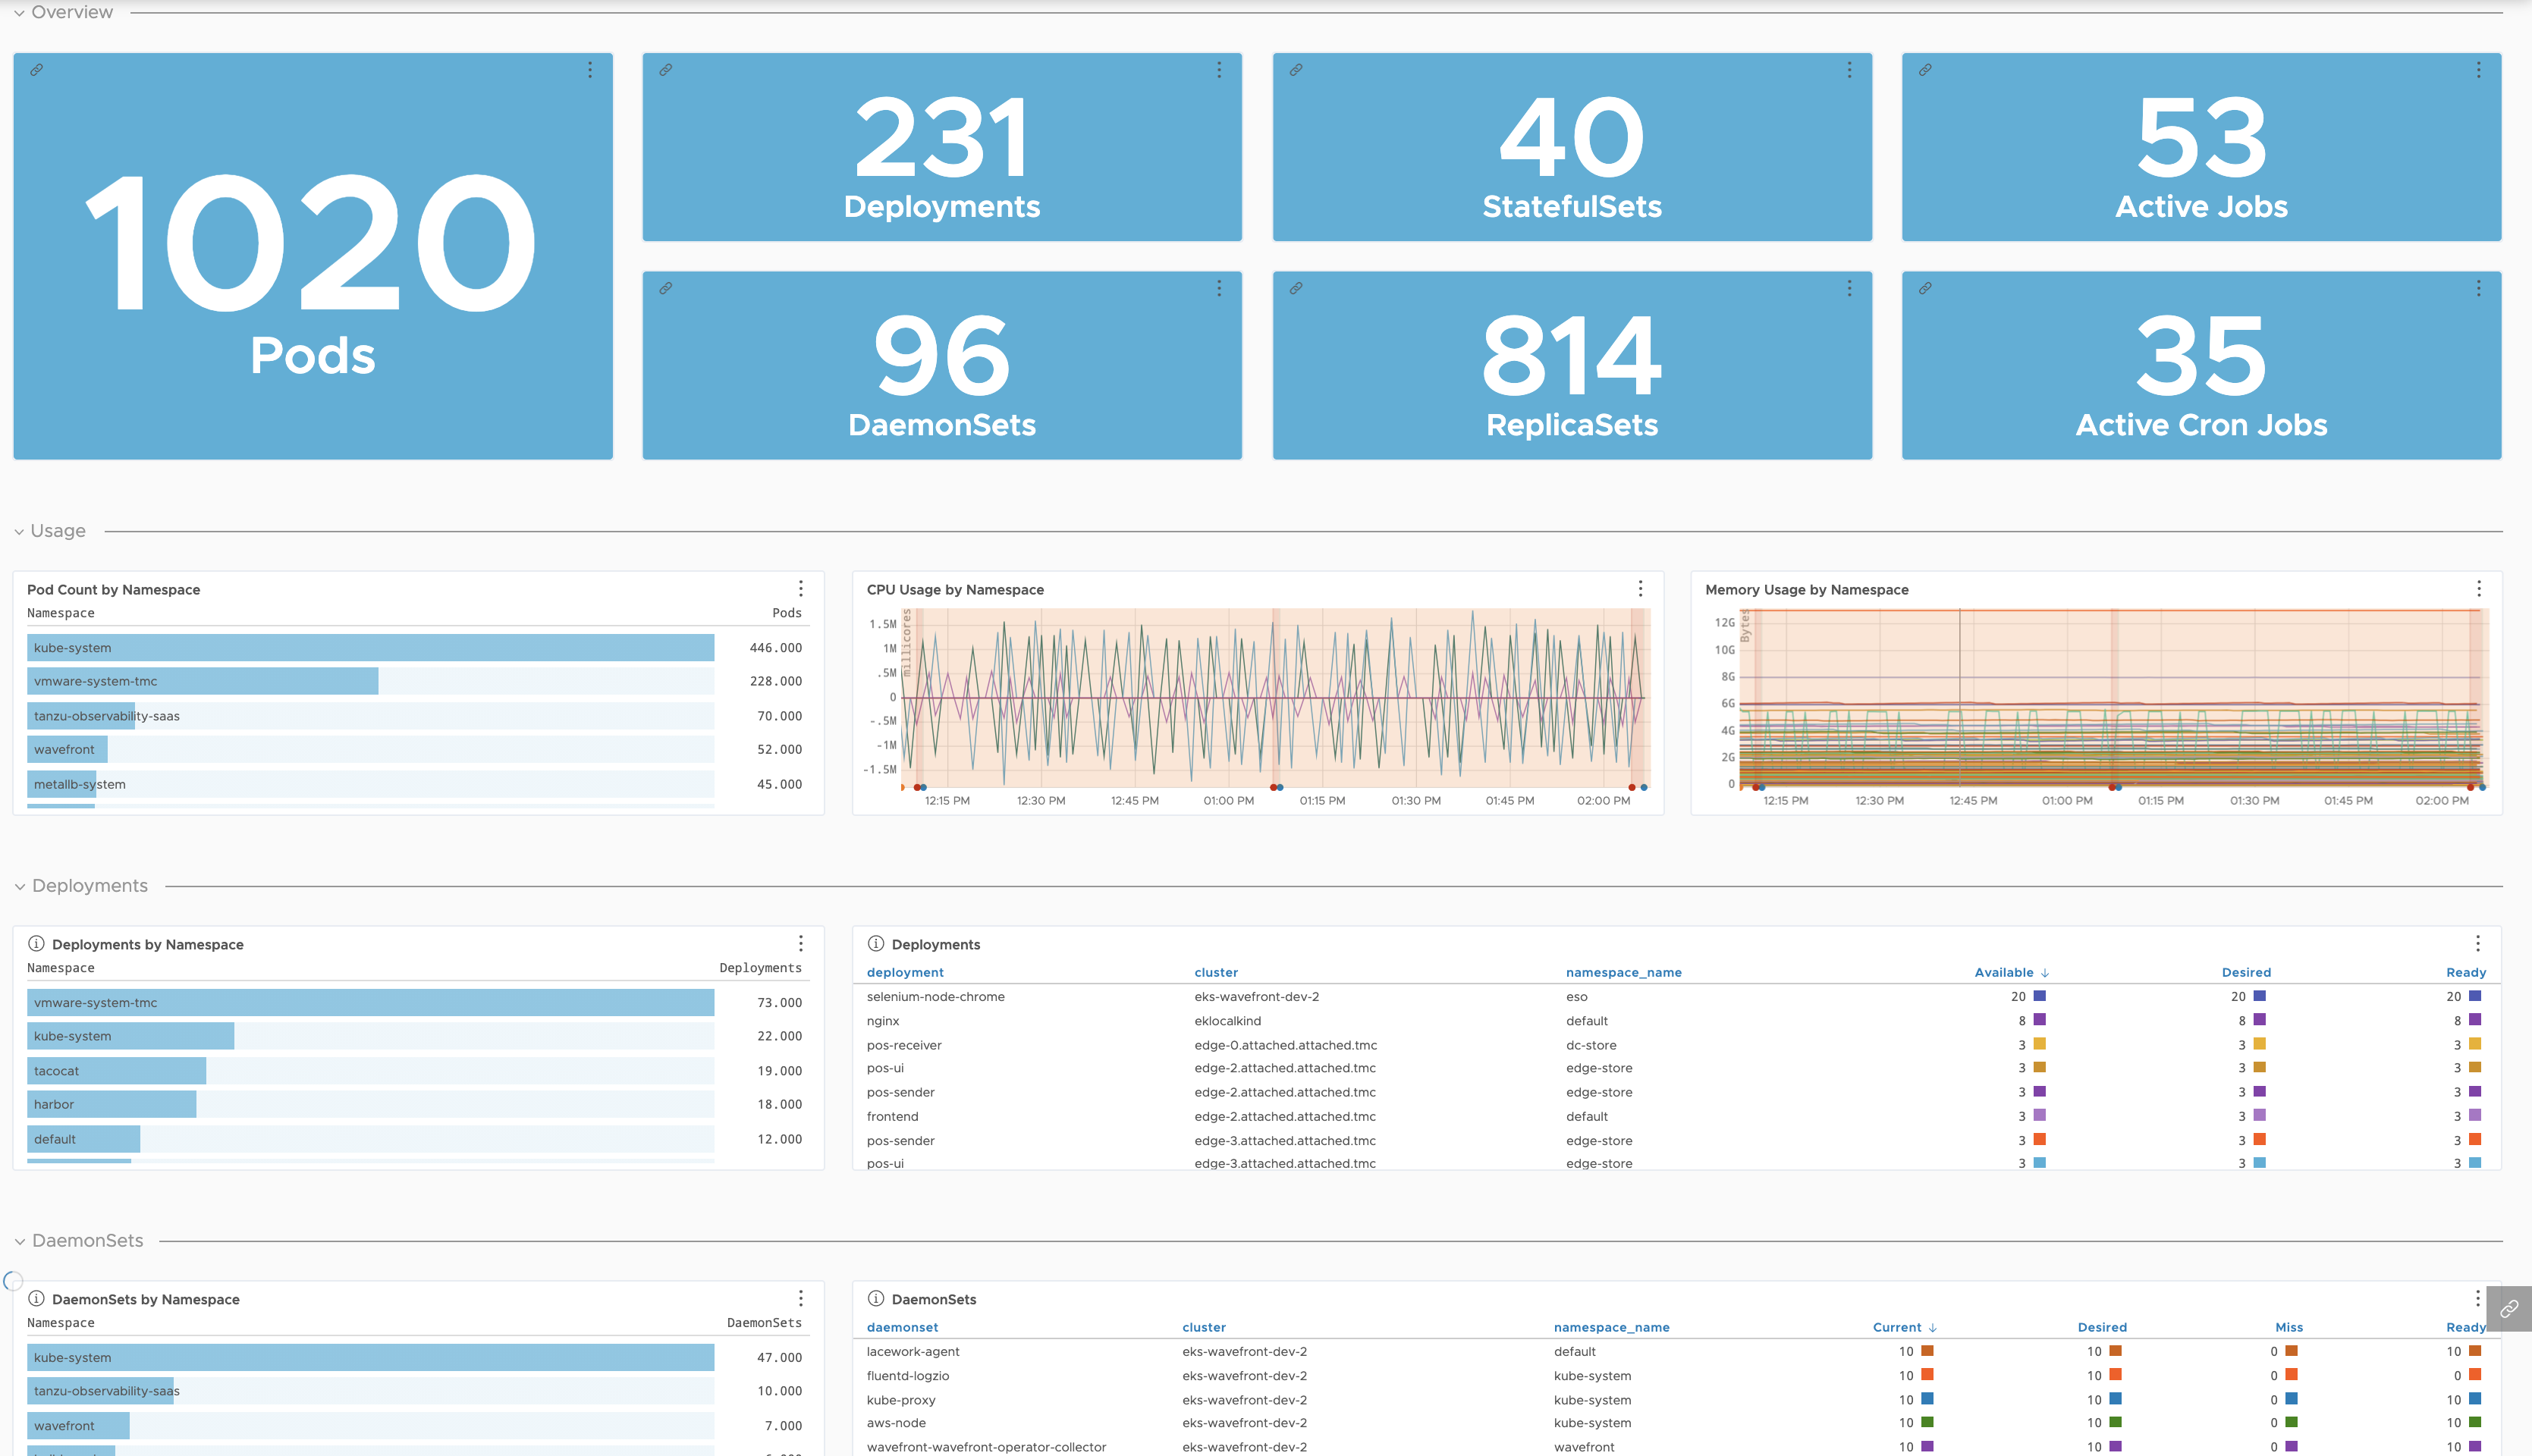
| Kubernetes Workloads Troubleshooting | Monitor and troubleshoot the Kubernetes workloads. | Kubernetes Summary |
Detailed health of your infrastructure and workloads.
|
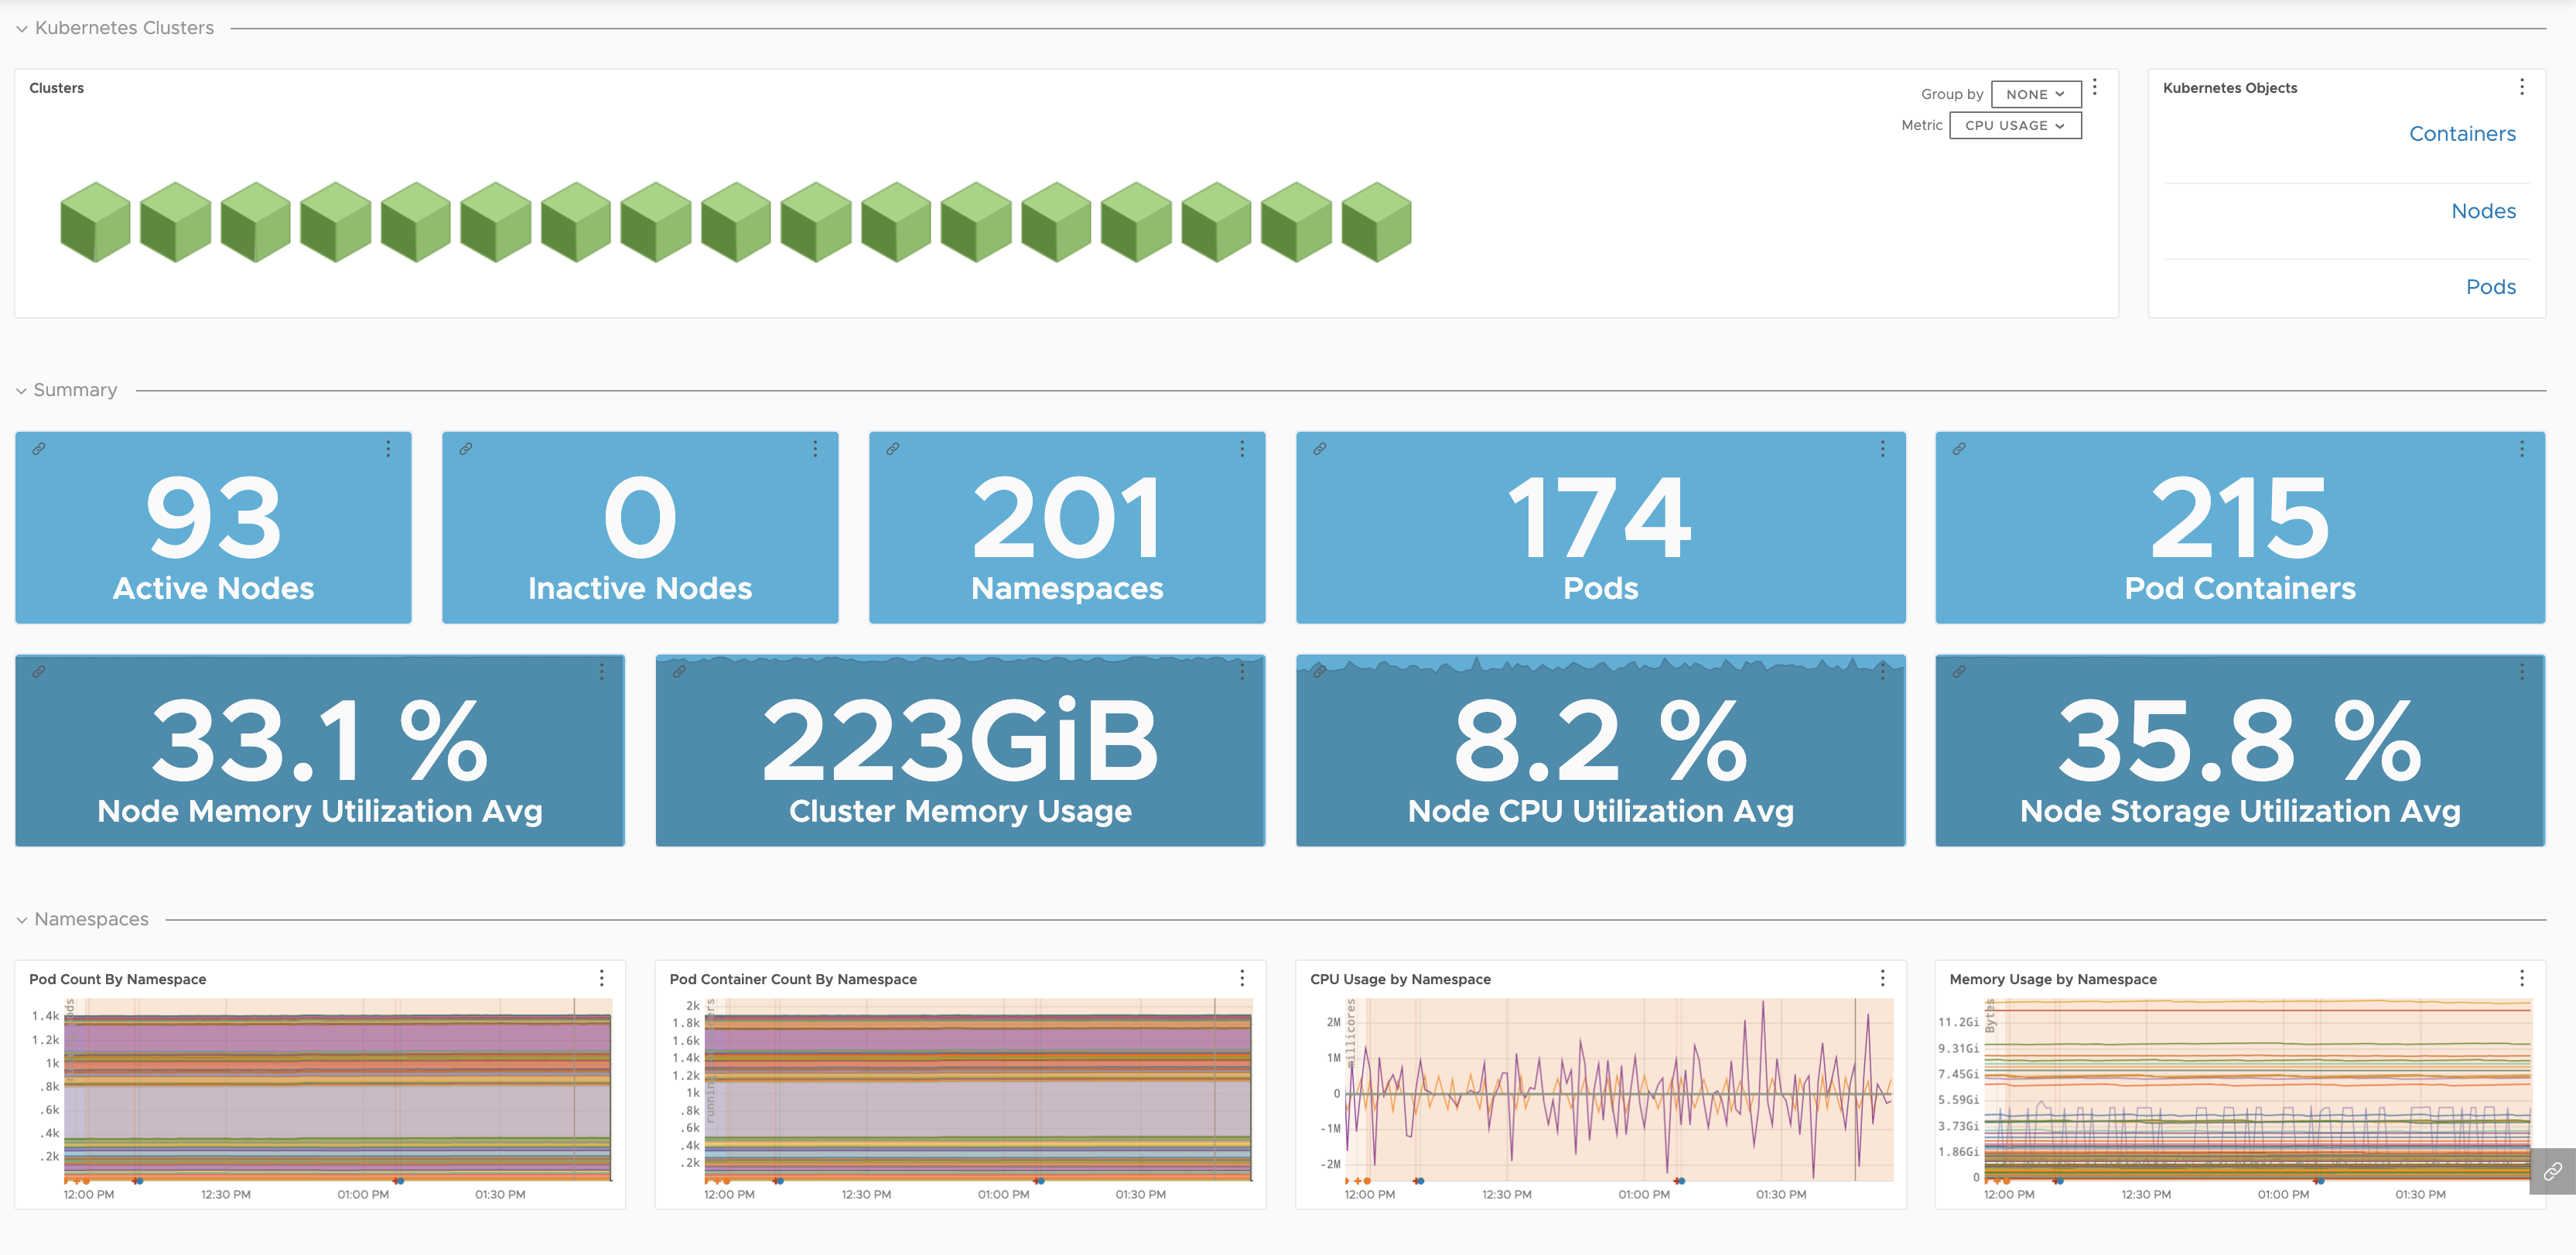
| Kubernetes Clusters |
Detailed health of your clusters and their nodes, namespaces, pods, and containers.
|
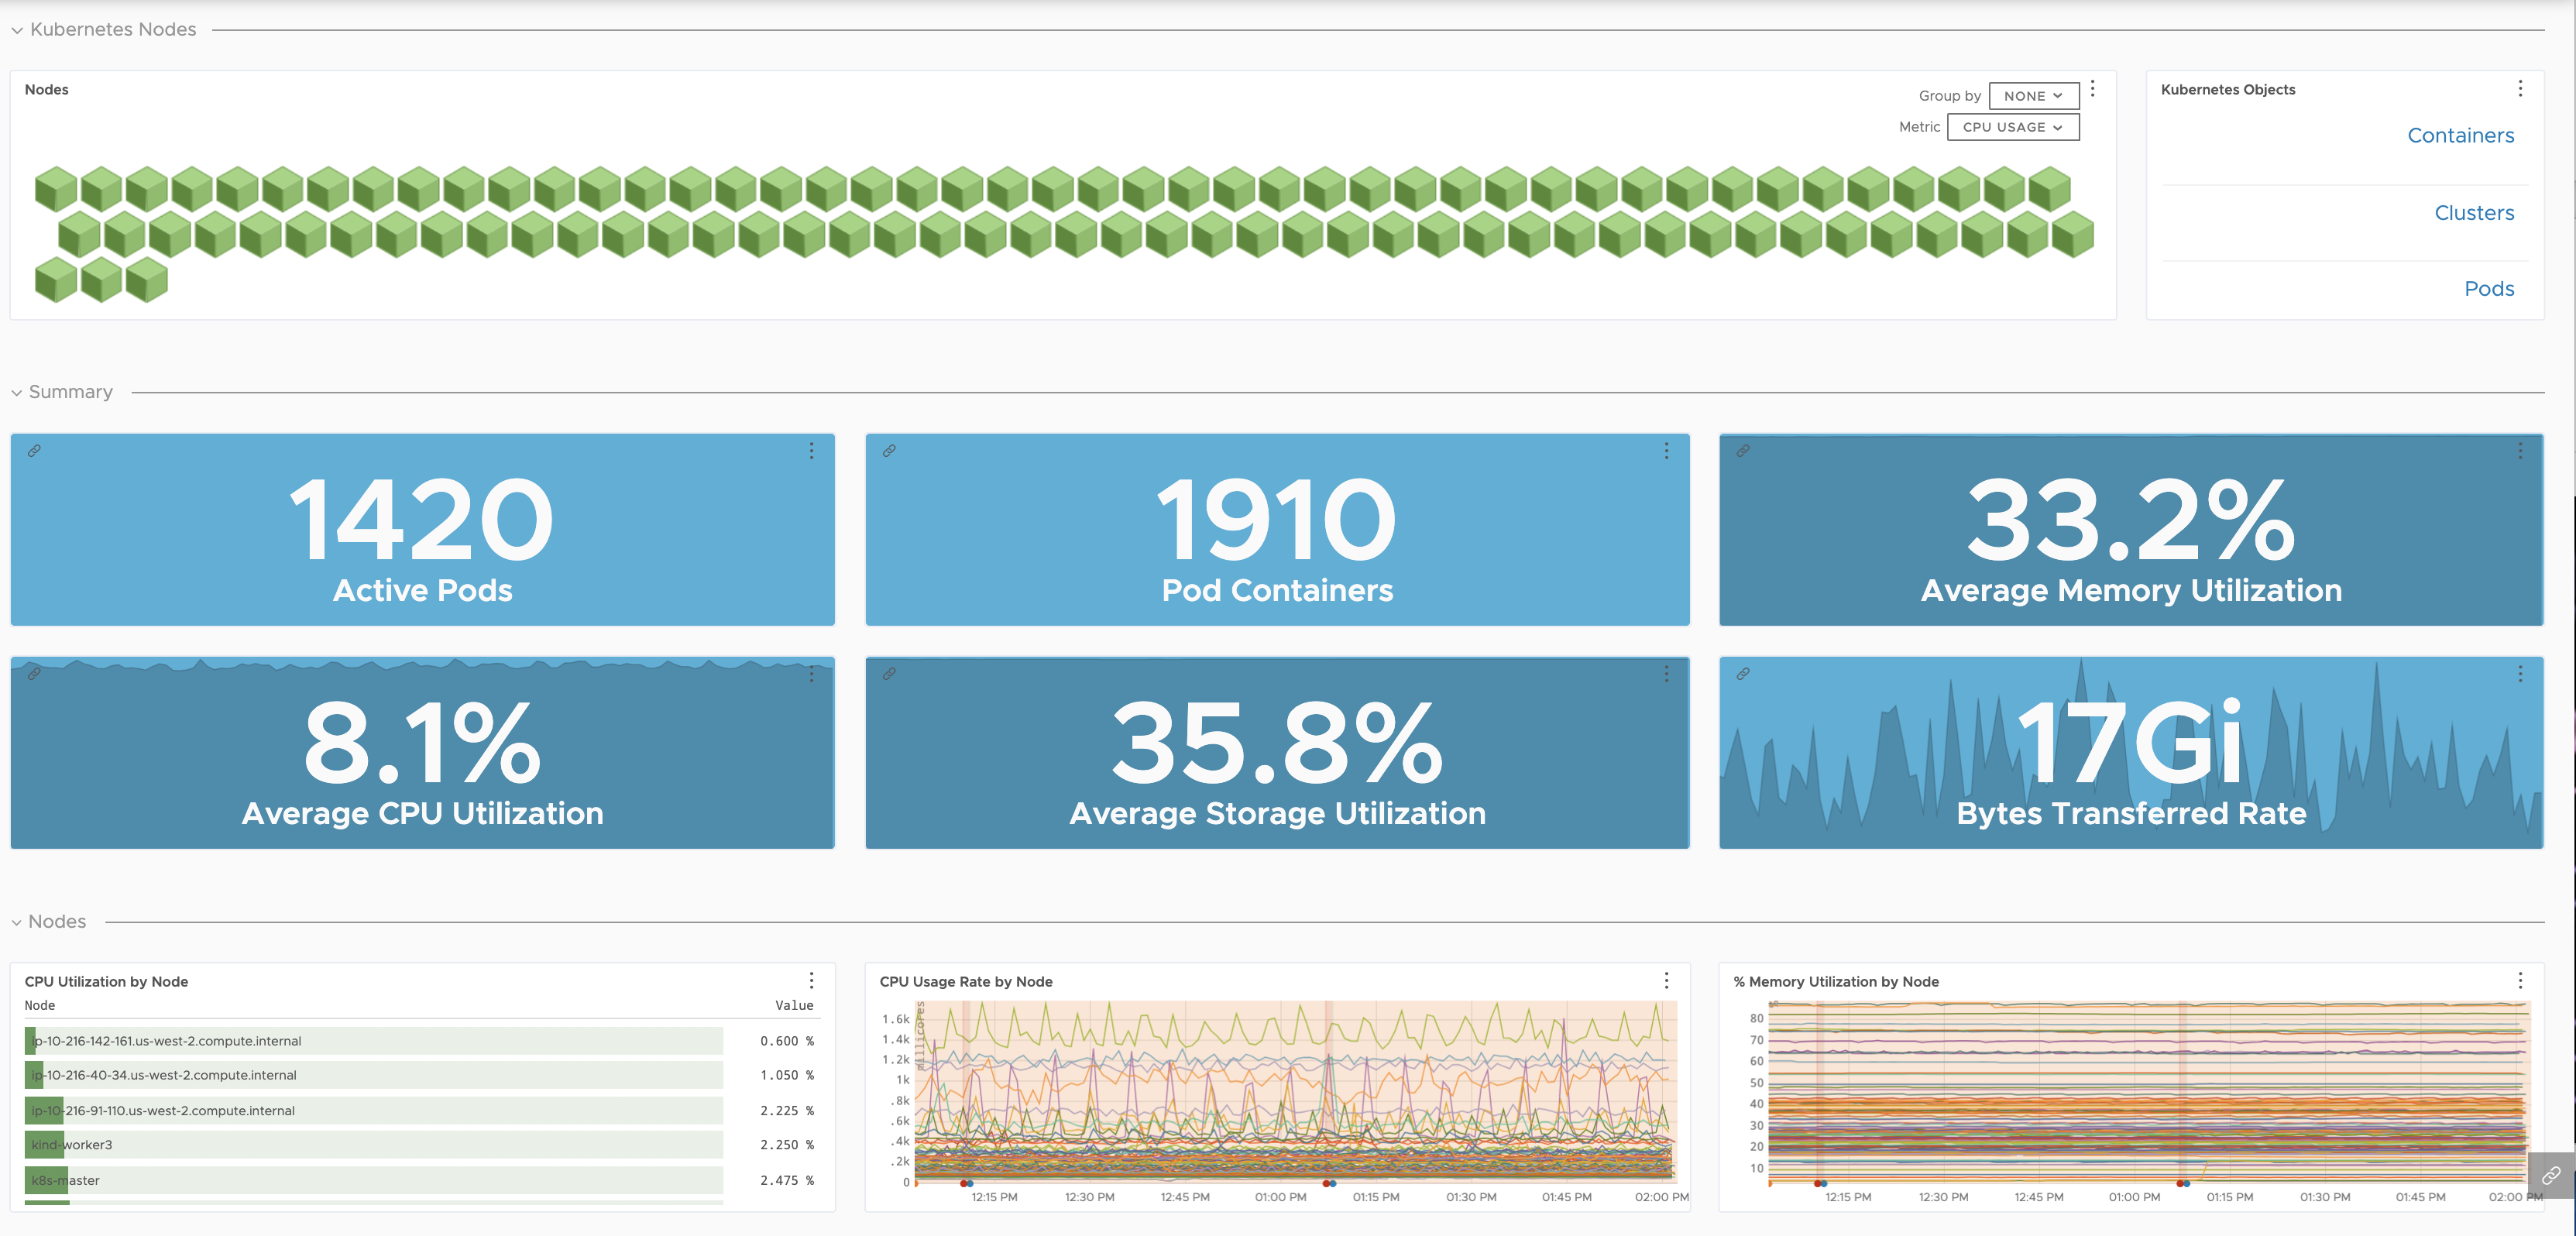
| Kubernetes Nodes |
Detailed health of your nodes.
|
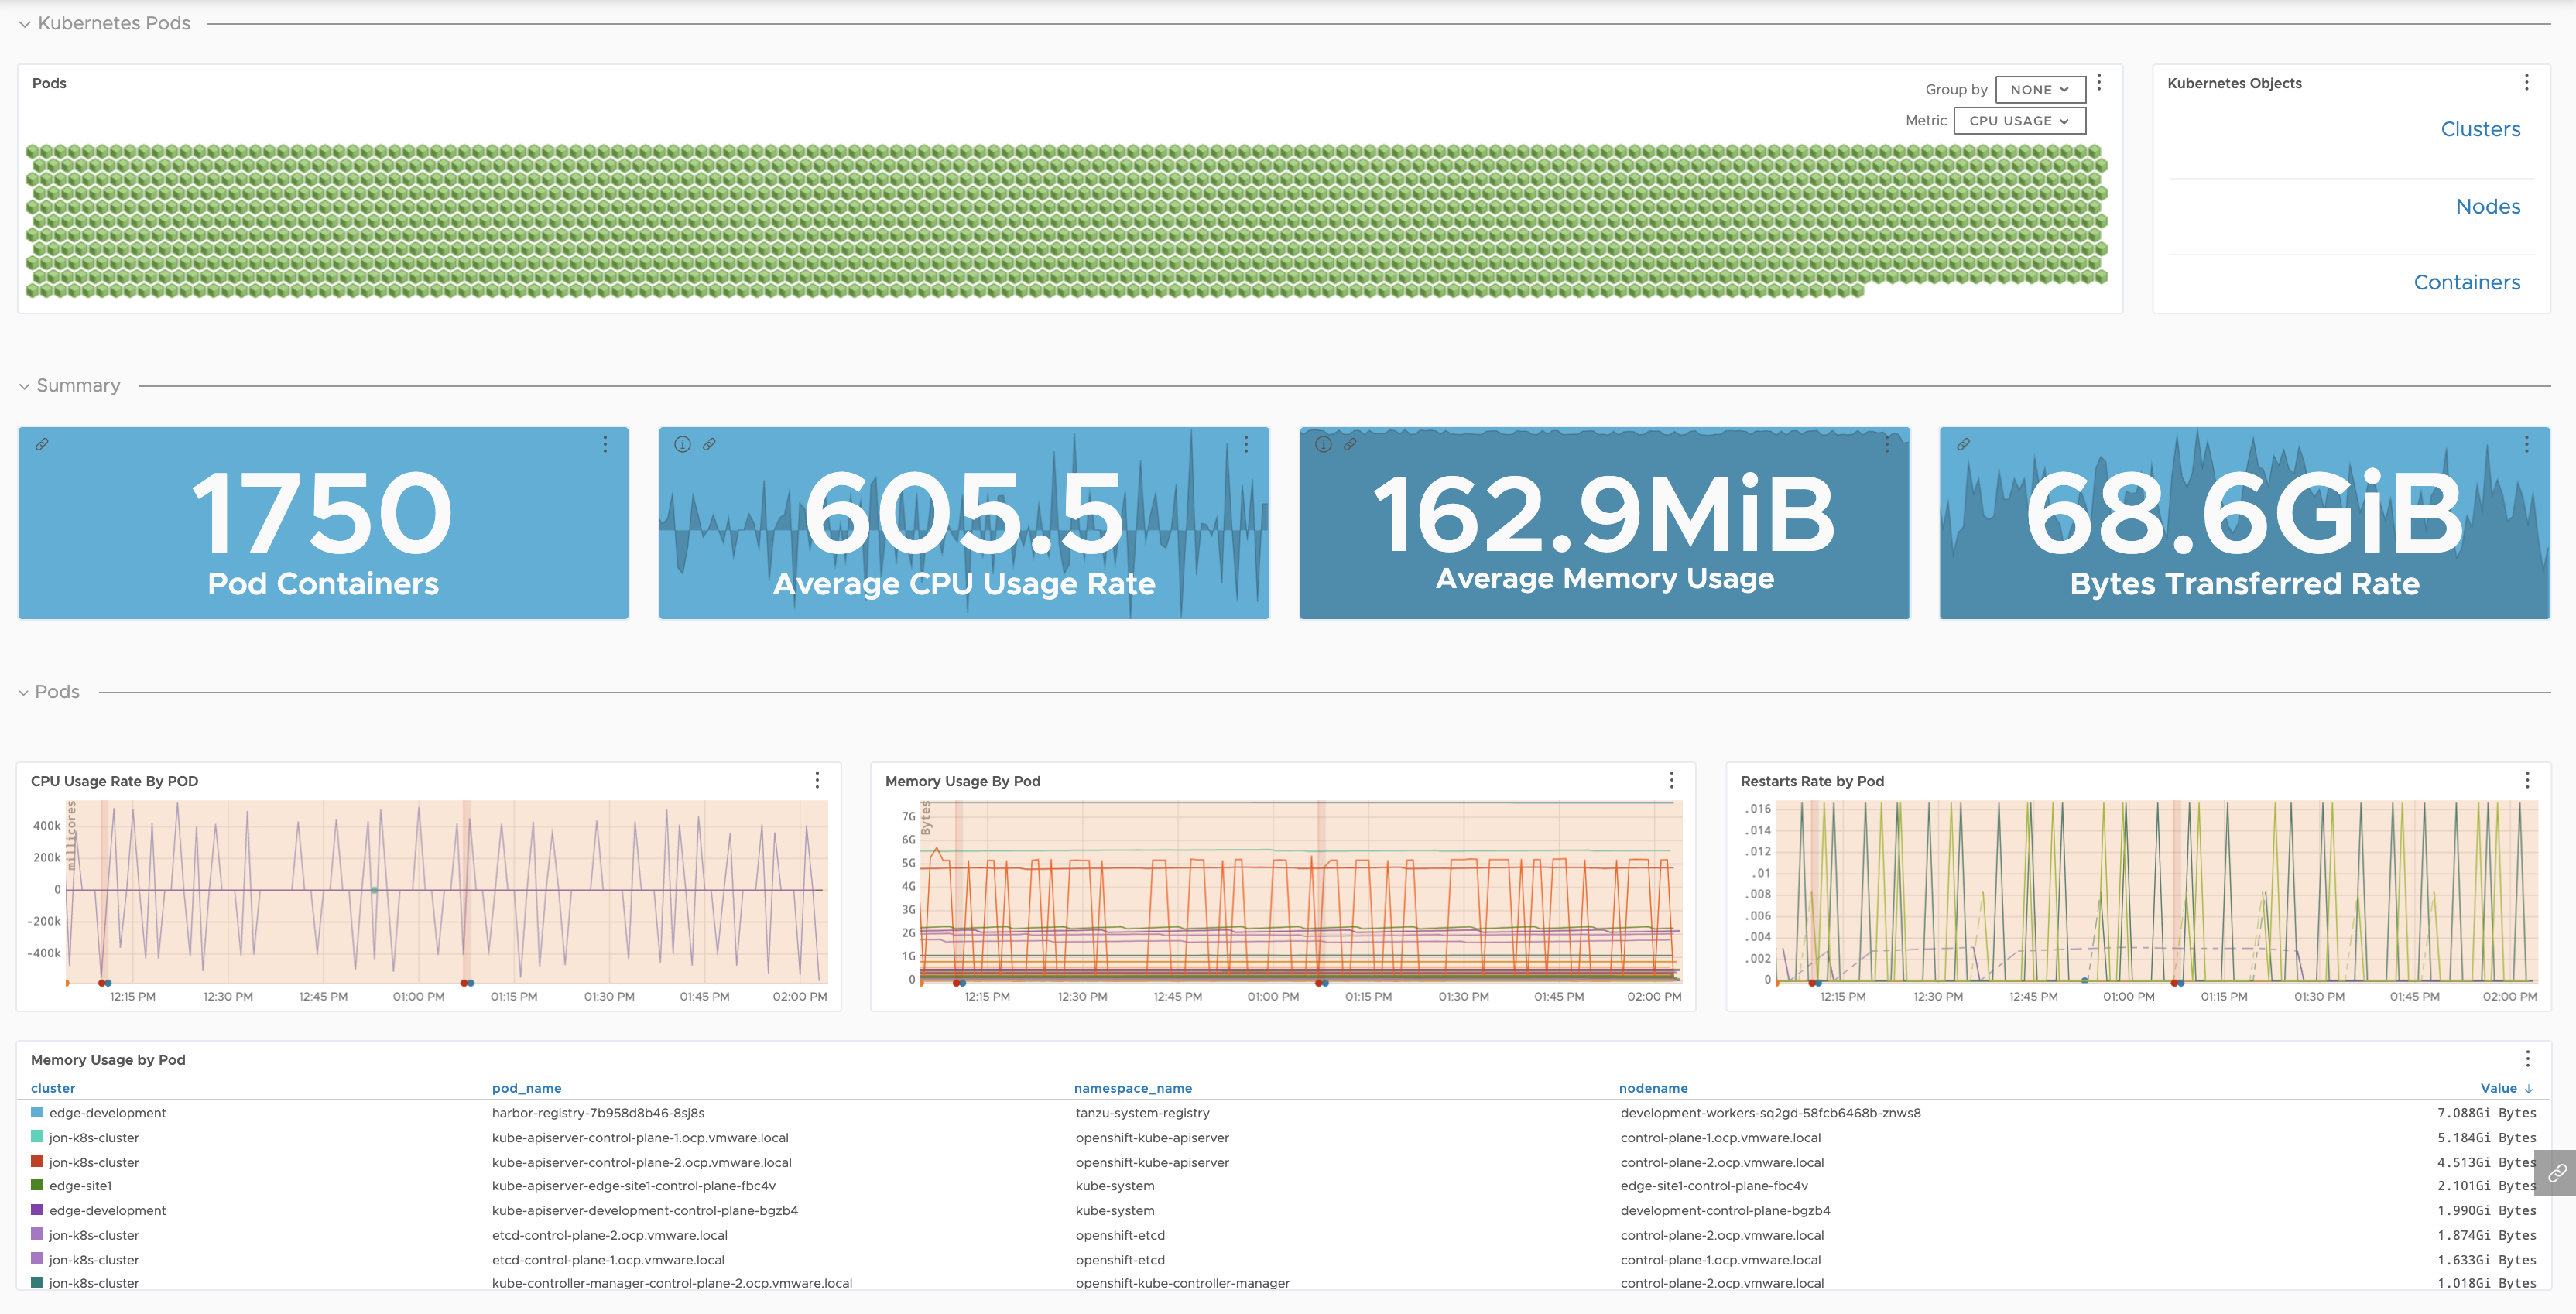
| Kubernetes Pods |
Detailed health of your pods broken down by node and namespace.
|
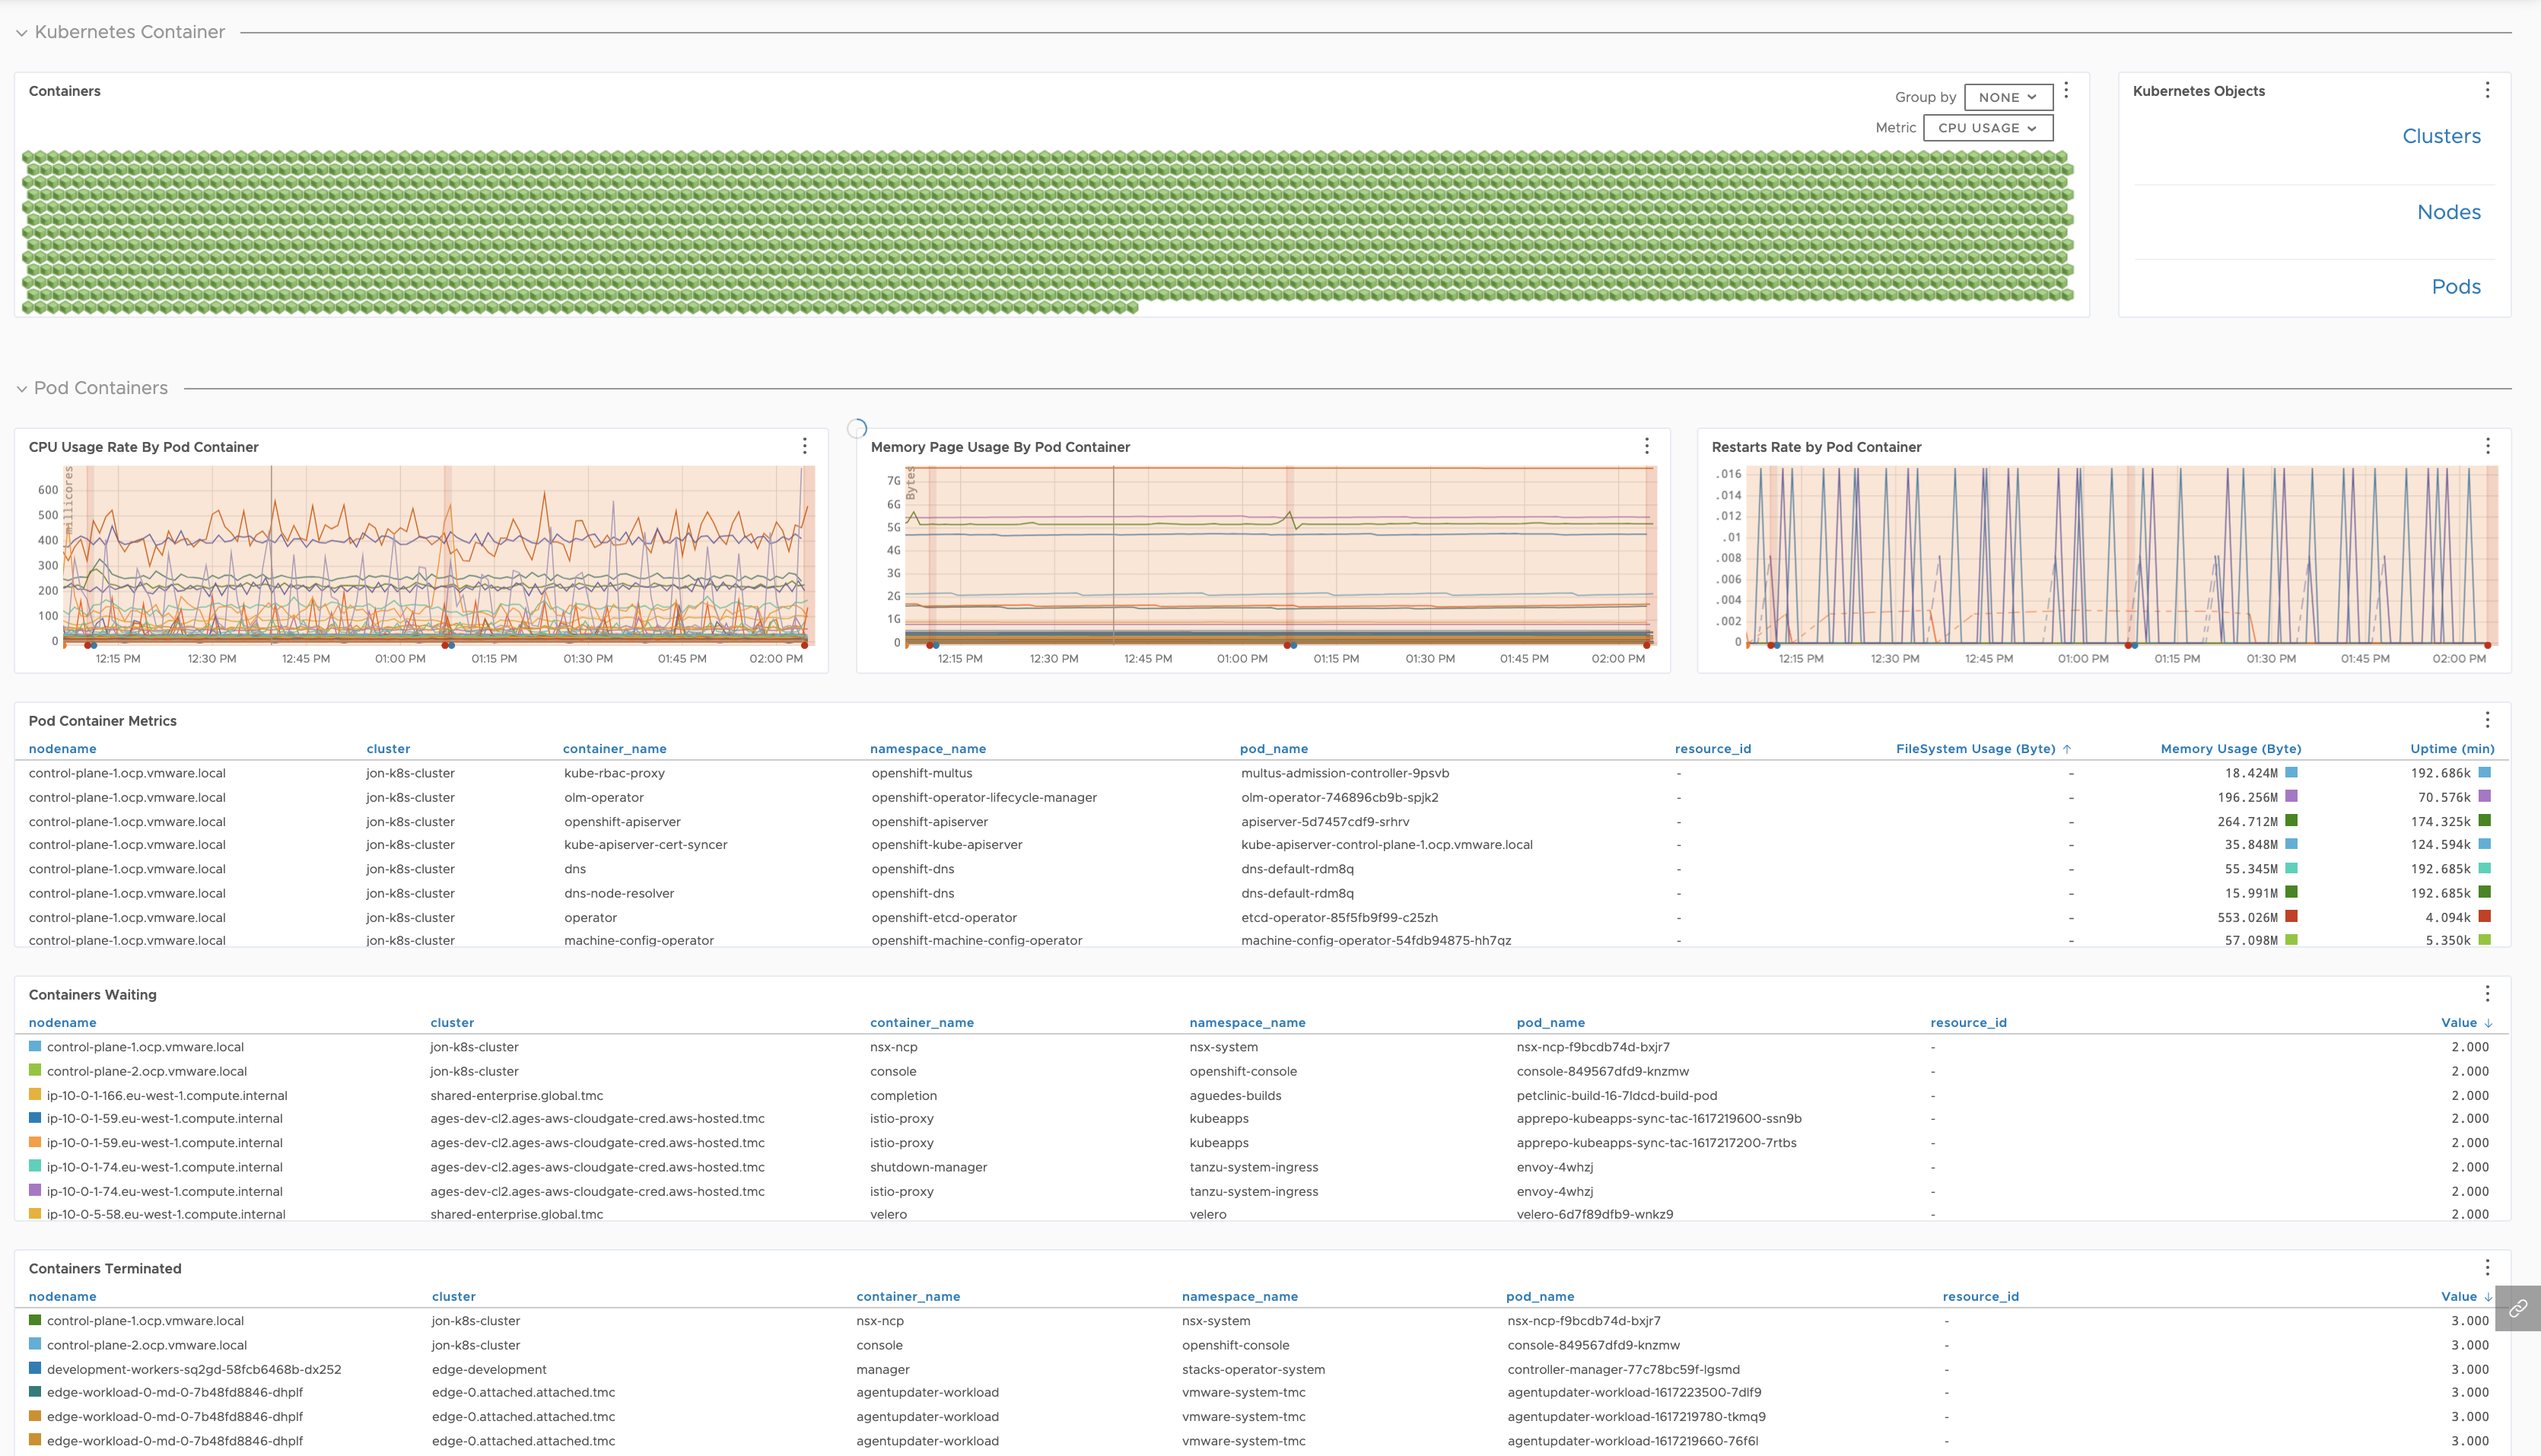
| Kubernetes Containers |
Detailed health of your containers broken down by namespace, node, and pod.
|
| Kubernetes Namespaces |
Details of your pods or containers broken down by namespace.
|
| Kubernetes Metrics Collector Troubleshooting |
Internal stats of the Kubernetes Metrics Collector.
|
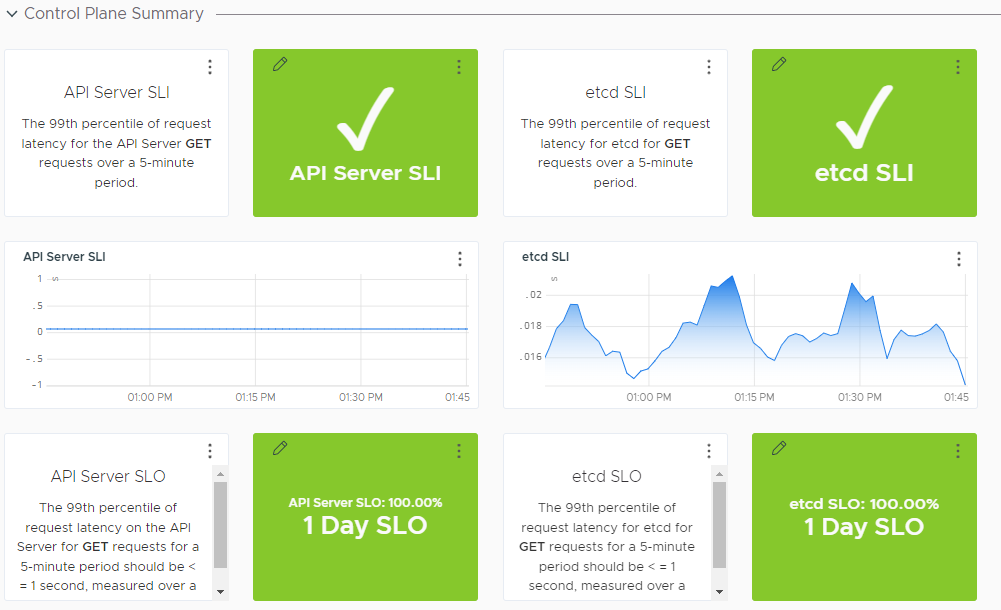
| Kubernetes Control Plane |
Details on the Kubernetes control plane components.
|
Scale Kubernetes
The default Kubernetes infrastructure can include a Horizontal Pod Autoscaler, which can automatically scale the number of pods. The Horizontal Pod Autoscaler gets CPU and memory information from the Kubernetes Metrics Server by default, and the Horizontal Pod Autoscaler uses that information.
Our Horizontal Pod Autoscaler Adapter allows you to scale based on any metric that it knows about.
For example, you can scale based on networking or disk metrics, or any application metrics that are available to VMware Aria Operations for Applications. The Autoscaler Adapter sends the recommendation to the Horizontal Pod Autoscaler, and the Kubernetes environment is kept healthy as a result.
Next Steps
- To monitor your Kubernetes clusters, set up the Kubernetes integration.