VMware Tanzu Mission Control provides a centralized management platform for consistently operating and securing your Kubernetes infrastructure and modern applications across multiple teams and clouds.
This document explains:
- How to set up and enable the integration from Tanzu Mission Control to VMware Aria Operations for Applications (formerly known as Tanzu Observability by Wavefront).
- How to monitor your Kubernetes environment with our pre-defined dashboards, and how to clone and customize those dashboards.
- How to troubleshoot common problems.
Create the Credential
To get started, you set up the integration from Tanzu Mission Control to VMware Aria Operations for Applications:
Step 1: Generate an API Token
In your product cluster, Generate a Service Account API Token for Tanzu Mission Control.
Step 2: In Tanzu Mission Control, Set Up the Integration
In the Tanzu Mission Control console:
|
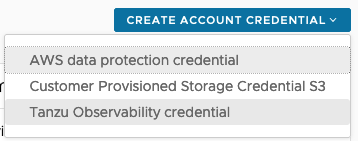 |
On the Create Tanzu Observability credential page, specify credential attributes:
|
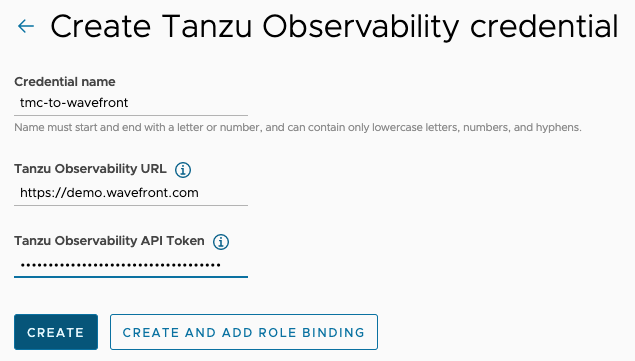 |
| Click the Integrations tab and verify that Tanzu Observability by Wavefront is enabled. If you don't see the integration as enabled after a few minutes, see the Troubleshooting section below. | 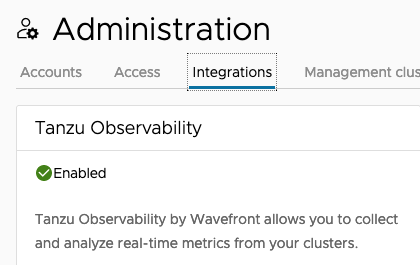 |
Enable Operations for Applications for a Cluster in Tanzu Mission Control
After you have set up the credential from Tanzu Mission Control, you can start enabling VMware Aria Operations for Applications for individual clusters that are managed by Tanzu Mission Control.
|
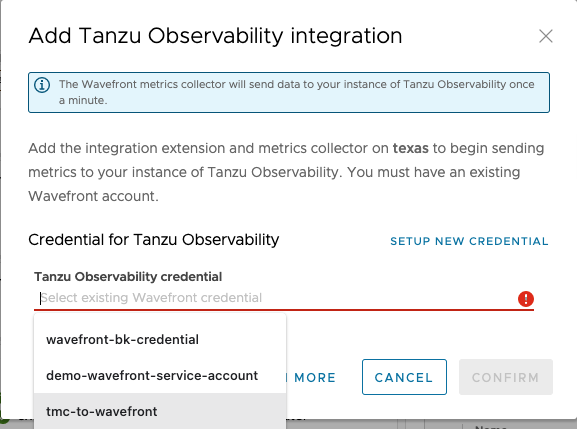 |
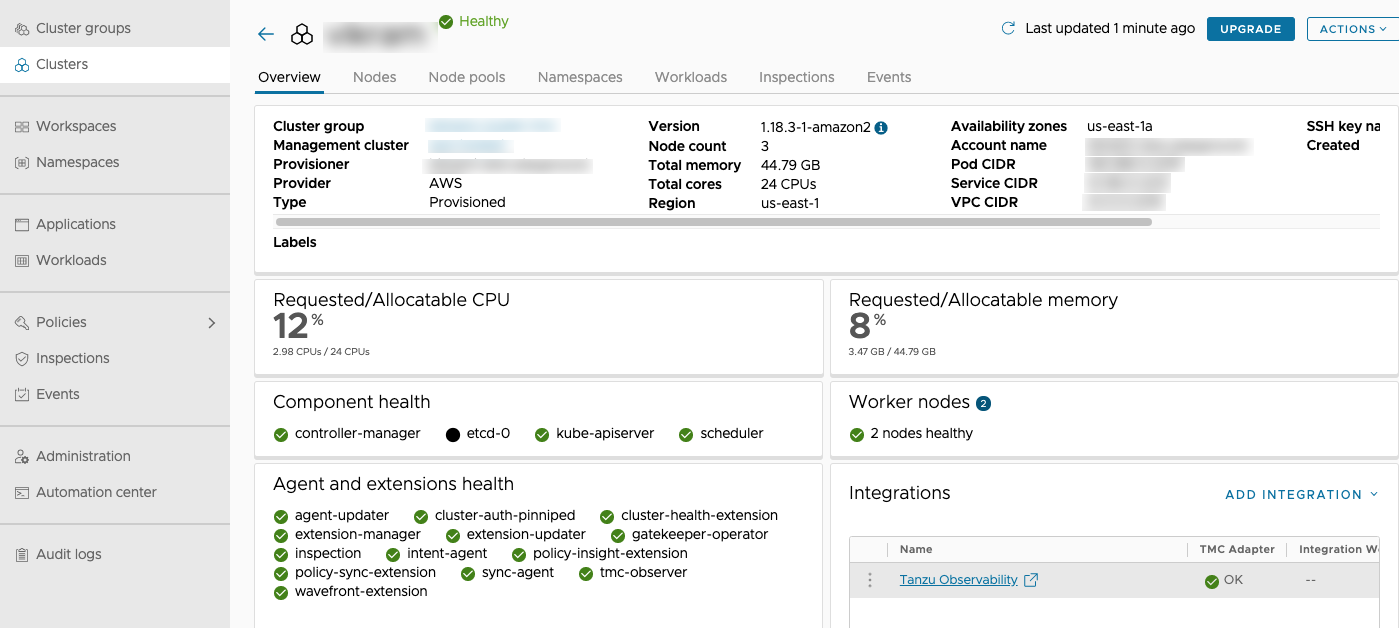
You can now click the link to VMware Aria Operations for Applications. You are redirected to a dashboard in the VMware Aria Operations for Applications instance that shows the metrics for the cluster.
Modify the Collector Configuration for a Cluster
You can use Tanzu Mission Control to modify the collector configuration that controls how data is sent to Operations for Applications.
The collector configuration for Operations for Applications specifies the details about the data that is sent to your Operations for Applications account, such as what data is collected and how often it is sent. Using Tanzu Mission Control, you can change the configuration to fine-tune the data collection for each of your clusters.
For more information about collector configuration for Operations for Applications, see the Wavefront Collector for Kubernetes configuration file in GitHub.
- Log in to the Tanzu Mission Control console as a user who has the cluster.admin role on the cluster.
- Navigate to the cluster that you want to configure.
-
On the cluster details page, in the top right corner, click Actions and select Tanzu Observability > Configure collector.
The Configure page displays the current YAML code for the Collector.
-
Edit the YAML code to modify the Collector configuration.
- You can edit the code directly in the provided code text box.
- If you have already edited the Collector, you can click Reset to Default Configuration to pull the default configuration from your Operations for Applications account.
- To load a new configuration from a file, click Import and select the file to import.
- To apply the changes to the YAML code, click Save.
Regardless of the method that you use to update the Collector configuration YAML code, your changes are not applied to the cluster until you save.
Examine Your Cluster’s Data in Dashboards
Dashboards allow you to drill down into your data, change the time window, examine individual charts, use filters, and much more.
Visualize Kubernetes Data has some specific information. For a general overview of dashboards and charts, see Examine Data with Dashboards and Charts or watch a short video. You can also watch the video here  . Note that this video was created in 2020 and some of the information in it might have changed. It also uses the 2020 version of the UI.
The Kubernetes dashboard that you land on from Tanzu Mission Control has several sections with detailed information.
| Scroll down for red flags on the dashboard, or use the Jump To menu to focus on the section you're interested in. | 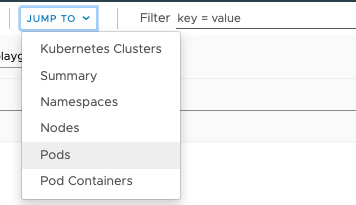 |
If you want to customize the charts in the dashboards or add more charts, you can clone the existing dashboard:
|
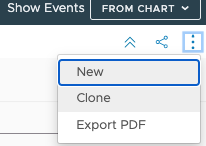 |
Troubleshooting
For some general recommendations, Kubernetes Troubleshooting. The following causes for failure and remediation steps are especially useful for Tanzu Mission Control troubleshooting.
Integrations Tile Shows Needs Attention
Symptom
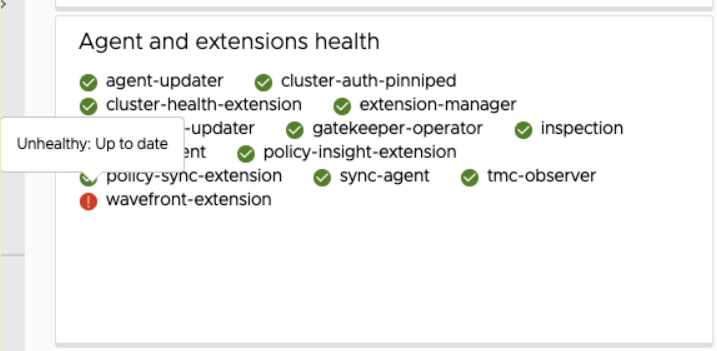
If the integration wasn’t set up successfully, the icon in the Integrations tile shows Needs Attention and the wavefront-extension icon in the Agent and extensions health tile shows Unhealthy. 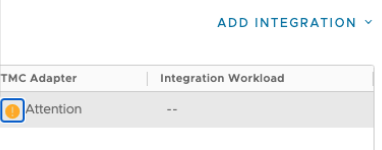
|
 |
Possible Causes
Failures might be caused by several issues including the following:
- Policy restrictions (access permission for pod)
- Nodes are not available for scheduling
- Not enough memory or CPU is available
- Image cannot be pulled
- Pod crash due to internal access logic error
- General issue on the Tanzu Mission Control side
- Issue with credential, for example, the API token might have been revoked.
Remediation
Follow these steps to remediate problems:
- Ensure that the cluster you want to connect to isn’t protected by an SSO solution. If it is, you might have to explicitly log in to the cluster as a user before you can display the dashboard.
- Ensure that the Wavefront API key is active and correctly entered. If the key was revoked, it’s no longer valid.
Cannot Modify Proxy (Installed Through Tanzu Mission Control)
Symptom
You’re monitoring your Kubernetes cluster with VMware Aria Operations for Applications. You installed VMware Aria Operations for Applications from Tanzu Mission Control. Now you’re having problems making a change to the Wavefront proxy.
Cause
If you installed VMware Aria Operations for Applications from Tanzu Mission Control, you cannot make changes to the Wavefront proxy.
Remediation
If your environment has a standalone VMware Aria Operations for Applications instance, use that instance. We are working on resolving the issue.
Learn More
- Watch the videos in the Getting Started playlist on VMware TV.
- Explore Your Data in the predefined Kubernetes dashboards.
- Clone any of the predefined dashboards and customize them.
- Learn how to Monitor and Scale Kubernetes.
- Learn more about Kubernetes Troubleshooting.