In this tutorial, you’ll learn how to:
- Send data from applications and services that run on your AWS account.
- Visualize data with preconfigured dashboards and charts.
- Set up and use a system alert.
It’s an easy setup. You don’t have to install anything or make changes to your application code.
|
 |
Task 1: Set Up the Integration
In this task, we’ll set up a data ingestion pipeline with AWS.
Step 1: Start Integration Setup
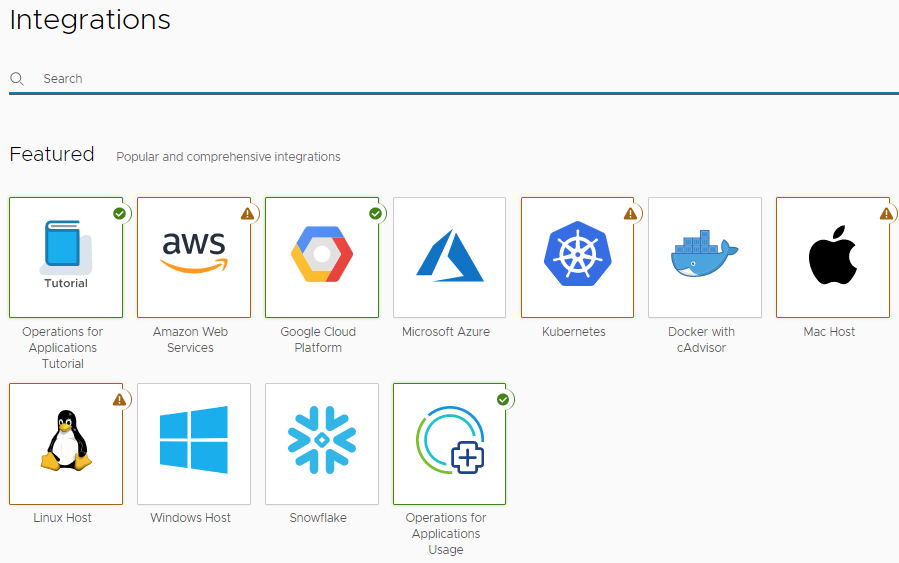
- Click Integrations on the toolbar.
An integration tile usually has:
- A Setup tab which provides step-by-step instructions on setting up the integration.
- A Dashboards tab to access the out-of-the-box dashboards. Popular integrations also have an Alerts tab with preconfigured alerts.
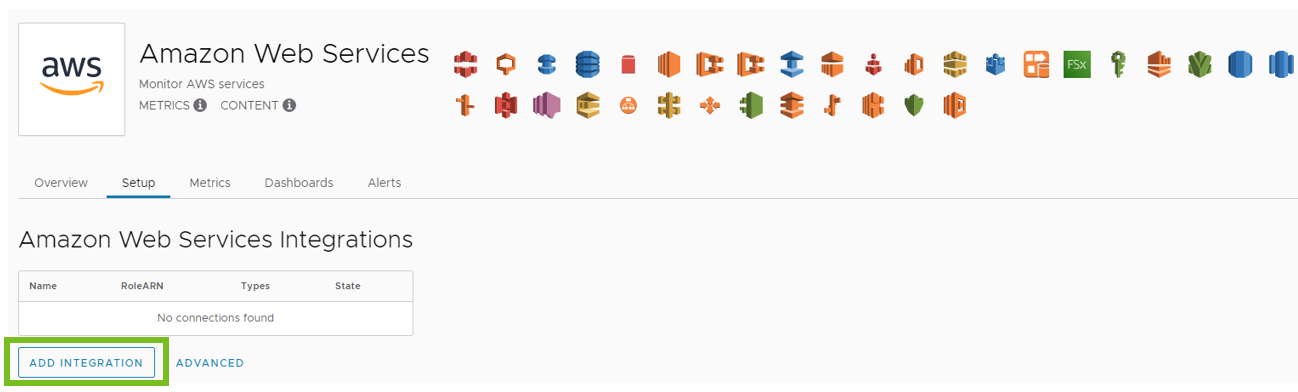
- Click the Amazon Web Services (AWS) tile.
- On the Setup tab, click Add Integration.
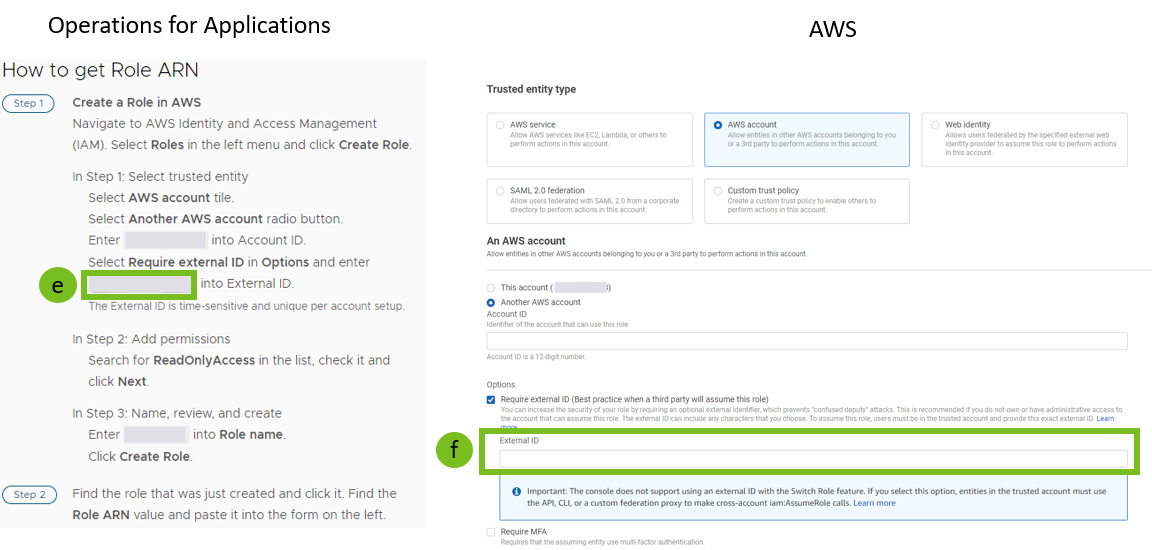
- Click the How to get Role ARN link.
You’ll see Account ID and External ID under How to get Role ARN. You’ll need them to set up the integration.
Step 2: Create a Read-Only Role in Your AWS Account
For this step, you must log in to your AWS account. Create a new AWS account if you don’t have one.
Follow these steps:
- Open a web browser tab and log in to your AWS account.
- Search for the IAM (AWS Identity and Access Management) service and click it to open the service.
- In the left panel, click Roles, and click Create role.
- Create a trusted entity:
- Click the AWS Account tile and select the Another AWS account radio button.
- Copy the Account ID value shown in the AWS integration setup instructions.
- Paste it in the Account ID text box in the AWS UI.
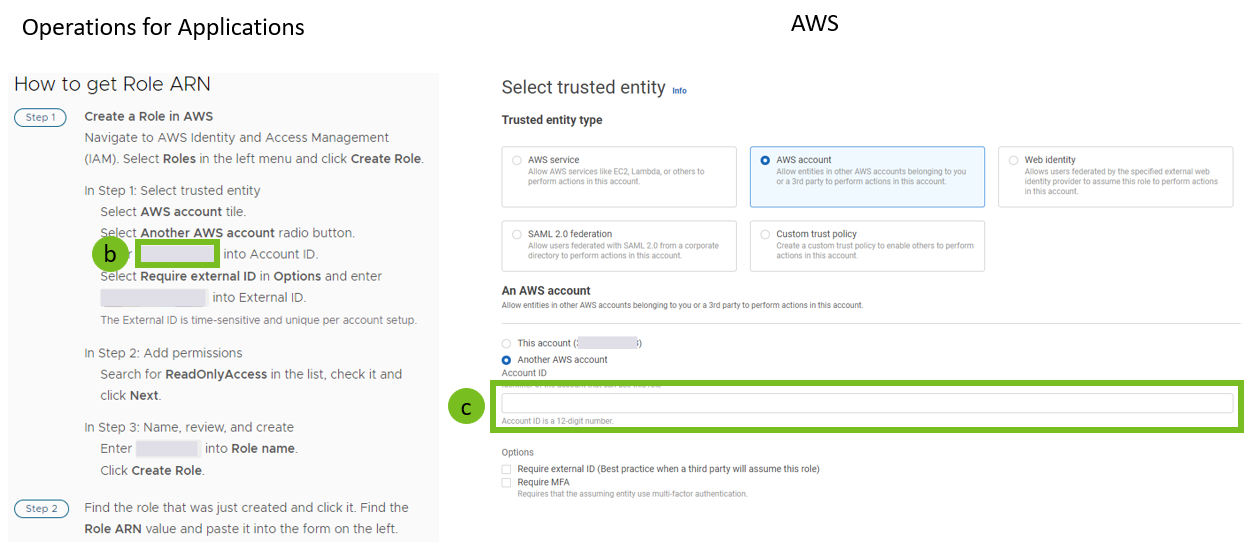
- Select the Require external ID check box.
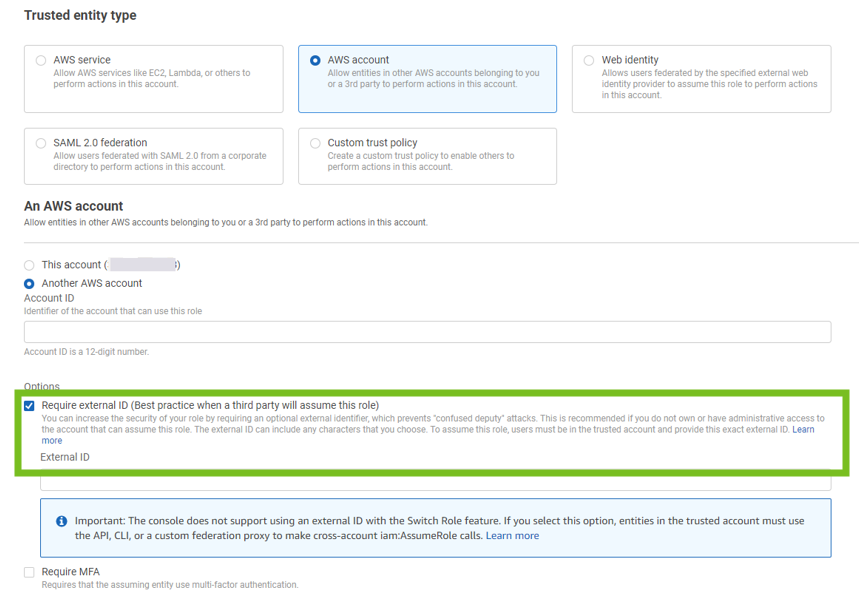
- Enter the External ID. Copy the External ID value shown in the AWS integration setup instructions and paste it here.
- Click Next.
- Set Permissions:
- Search for the ReadOnlyAccess permission and select it.
Note: You get many results when you search for ReadOnlyAccess. Scroll down and browse through the pages until you find ReadOnlyAccess, as shown in the screenshot below.
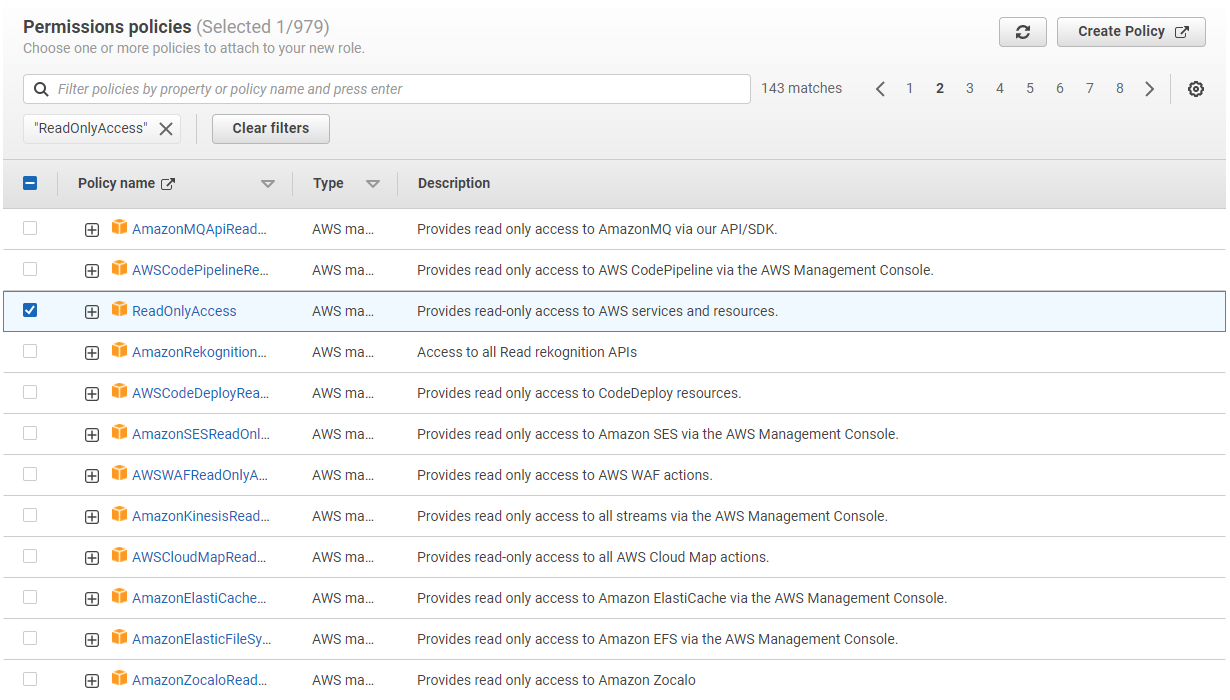
- Click Next.
- Search for the ReadOnlyAccess permission and select it.
- Set the Role name as
example-role. - Click Create role.
- Once the list of roles appears, click
example-role(the role you just created), and copy the ARN value.
Step 3: Configure the AWS Integration
Go back to the product instance where you opened the AWS integration tile, and follow these steps:
|
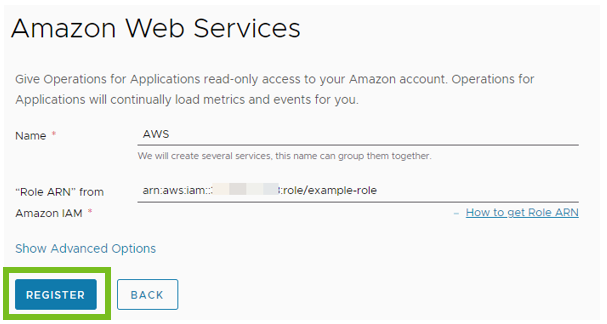 |
VMware Aria Operations for Applications can now connect to your AWS account and get data. Once the data starts flowing, you can visualize it. It will take a few minutes for the data to show.
Step 4: (Optional) Launch an EC2 Instance
Don’t have an application running on your AWS account? Follow the steps given below. If you already have an application running on the AWS account, move to the next task and see how you can visualize your data.
- Go back to your AWS account, search for the EC2 service, and click it to open the service.
- Follow the AWS documentation on Launching an Amazon EC2 Instance.
Once the instance is launched, you’ll see the data after a few minutes.
Learn More About Data Ingestion and the AWS Integration
- Set Up Data Ingestion has information on data ingestion, including a video.
- Amazon Web Services Integration has more information on the AWS integration.
- Set up and manage the AWS Integration by Using the API.
- See the List of our integrations.
Task 2: Explore Data with Out-of-the-Box Dashboards
With data flowing, you can start exploring dashboards and charts:
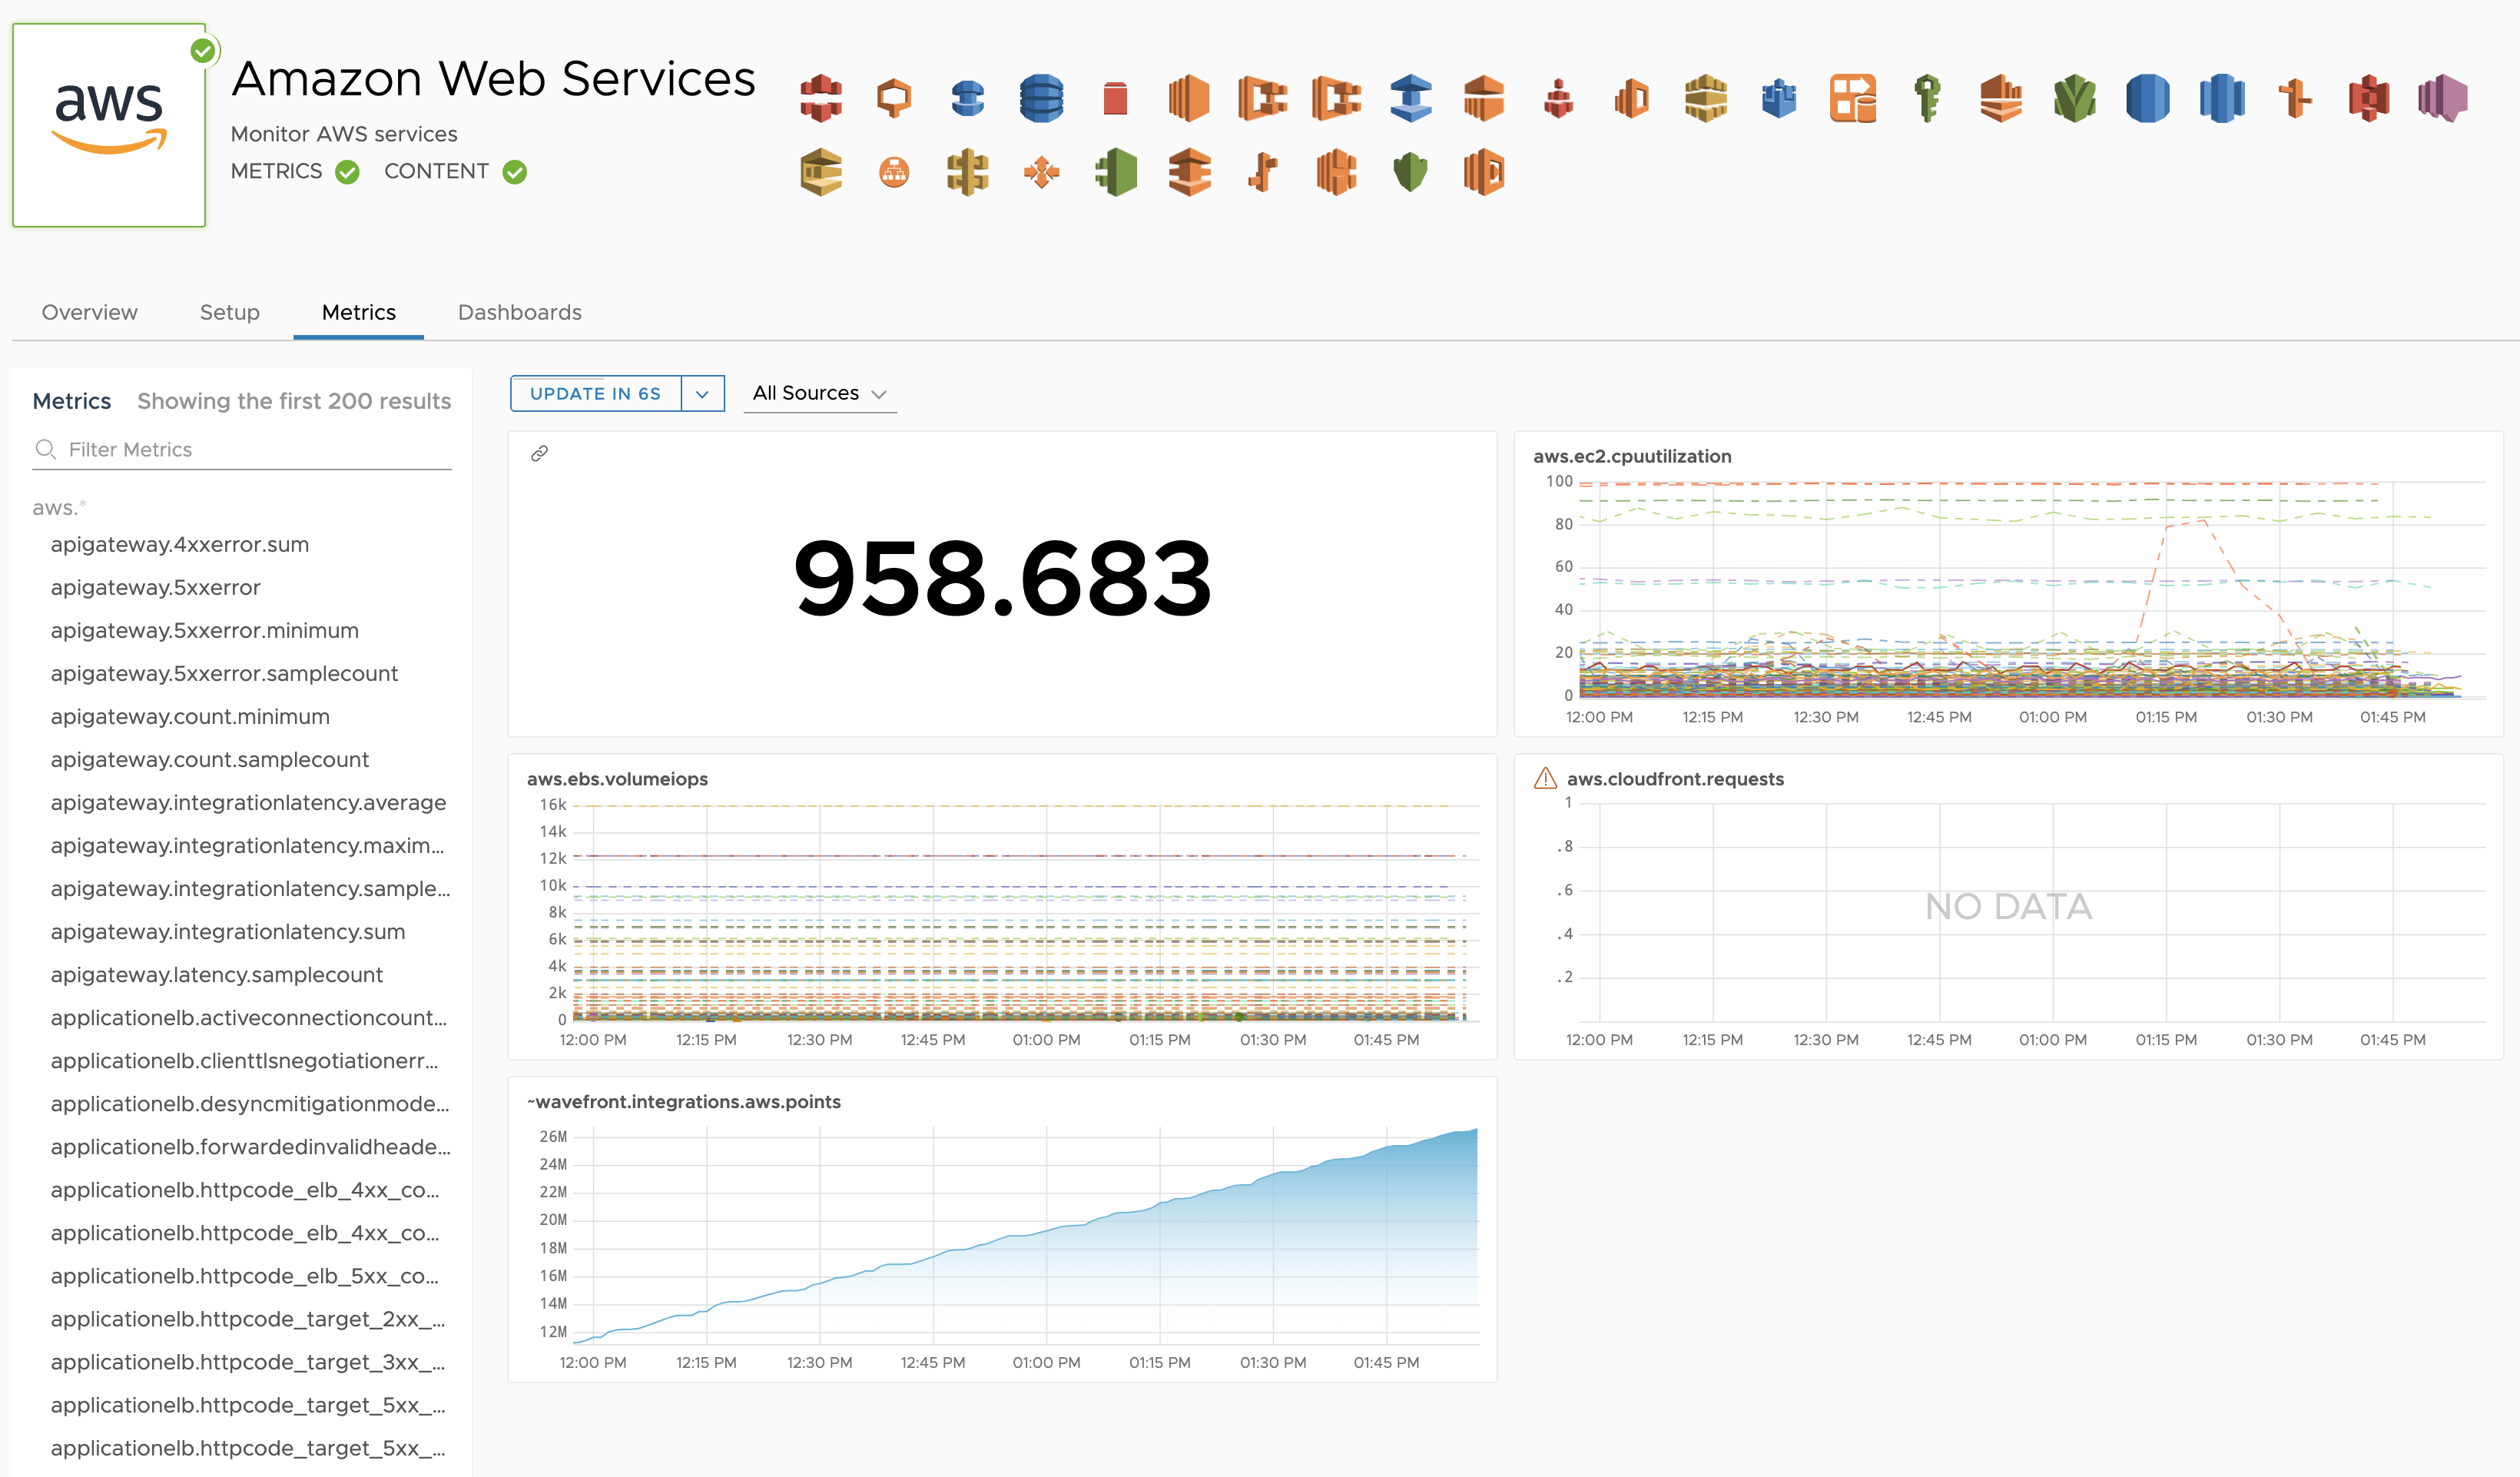
View Metrics
- In your product instance, navigate to the AWS integration.
- Click the Metrics tab.
You see charts with the metrics collected from your AWS account.
Example:
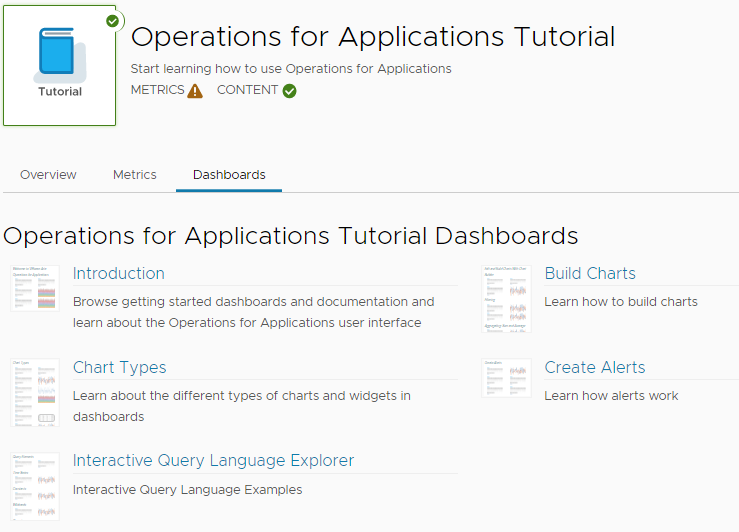
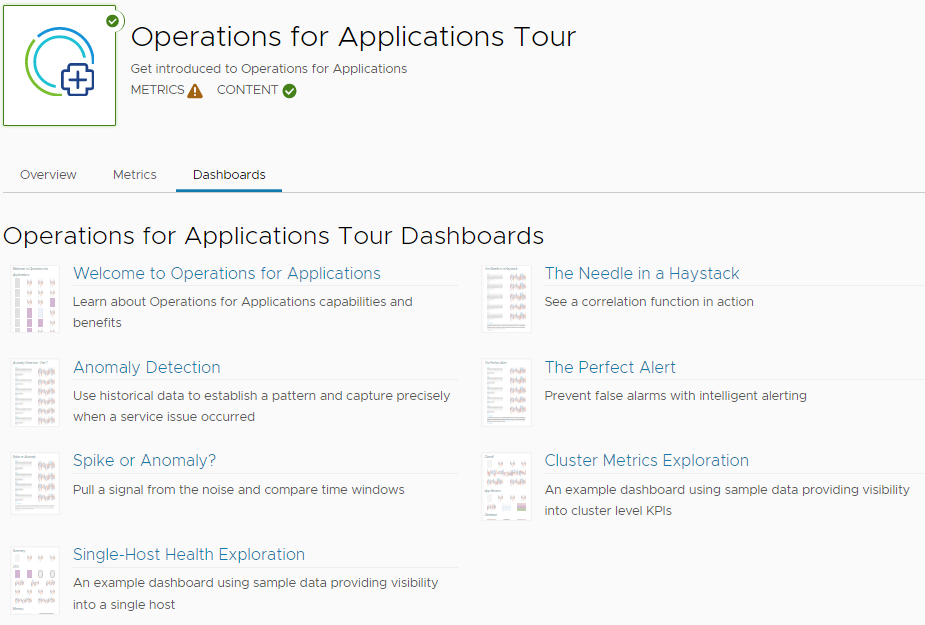
View Data on Dashboards
Our service includes system dashboards for the AWS integration that help you analyze and gather data.
- To see the list of the system dashboards, click the Dashboards tab.
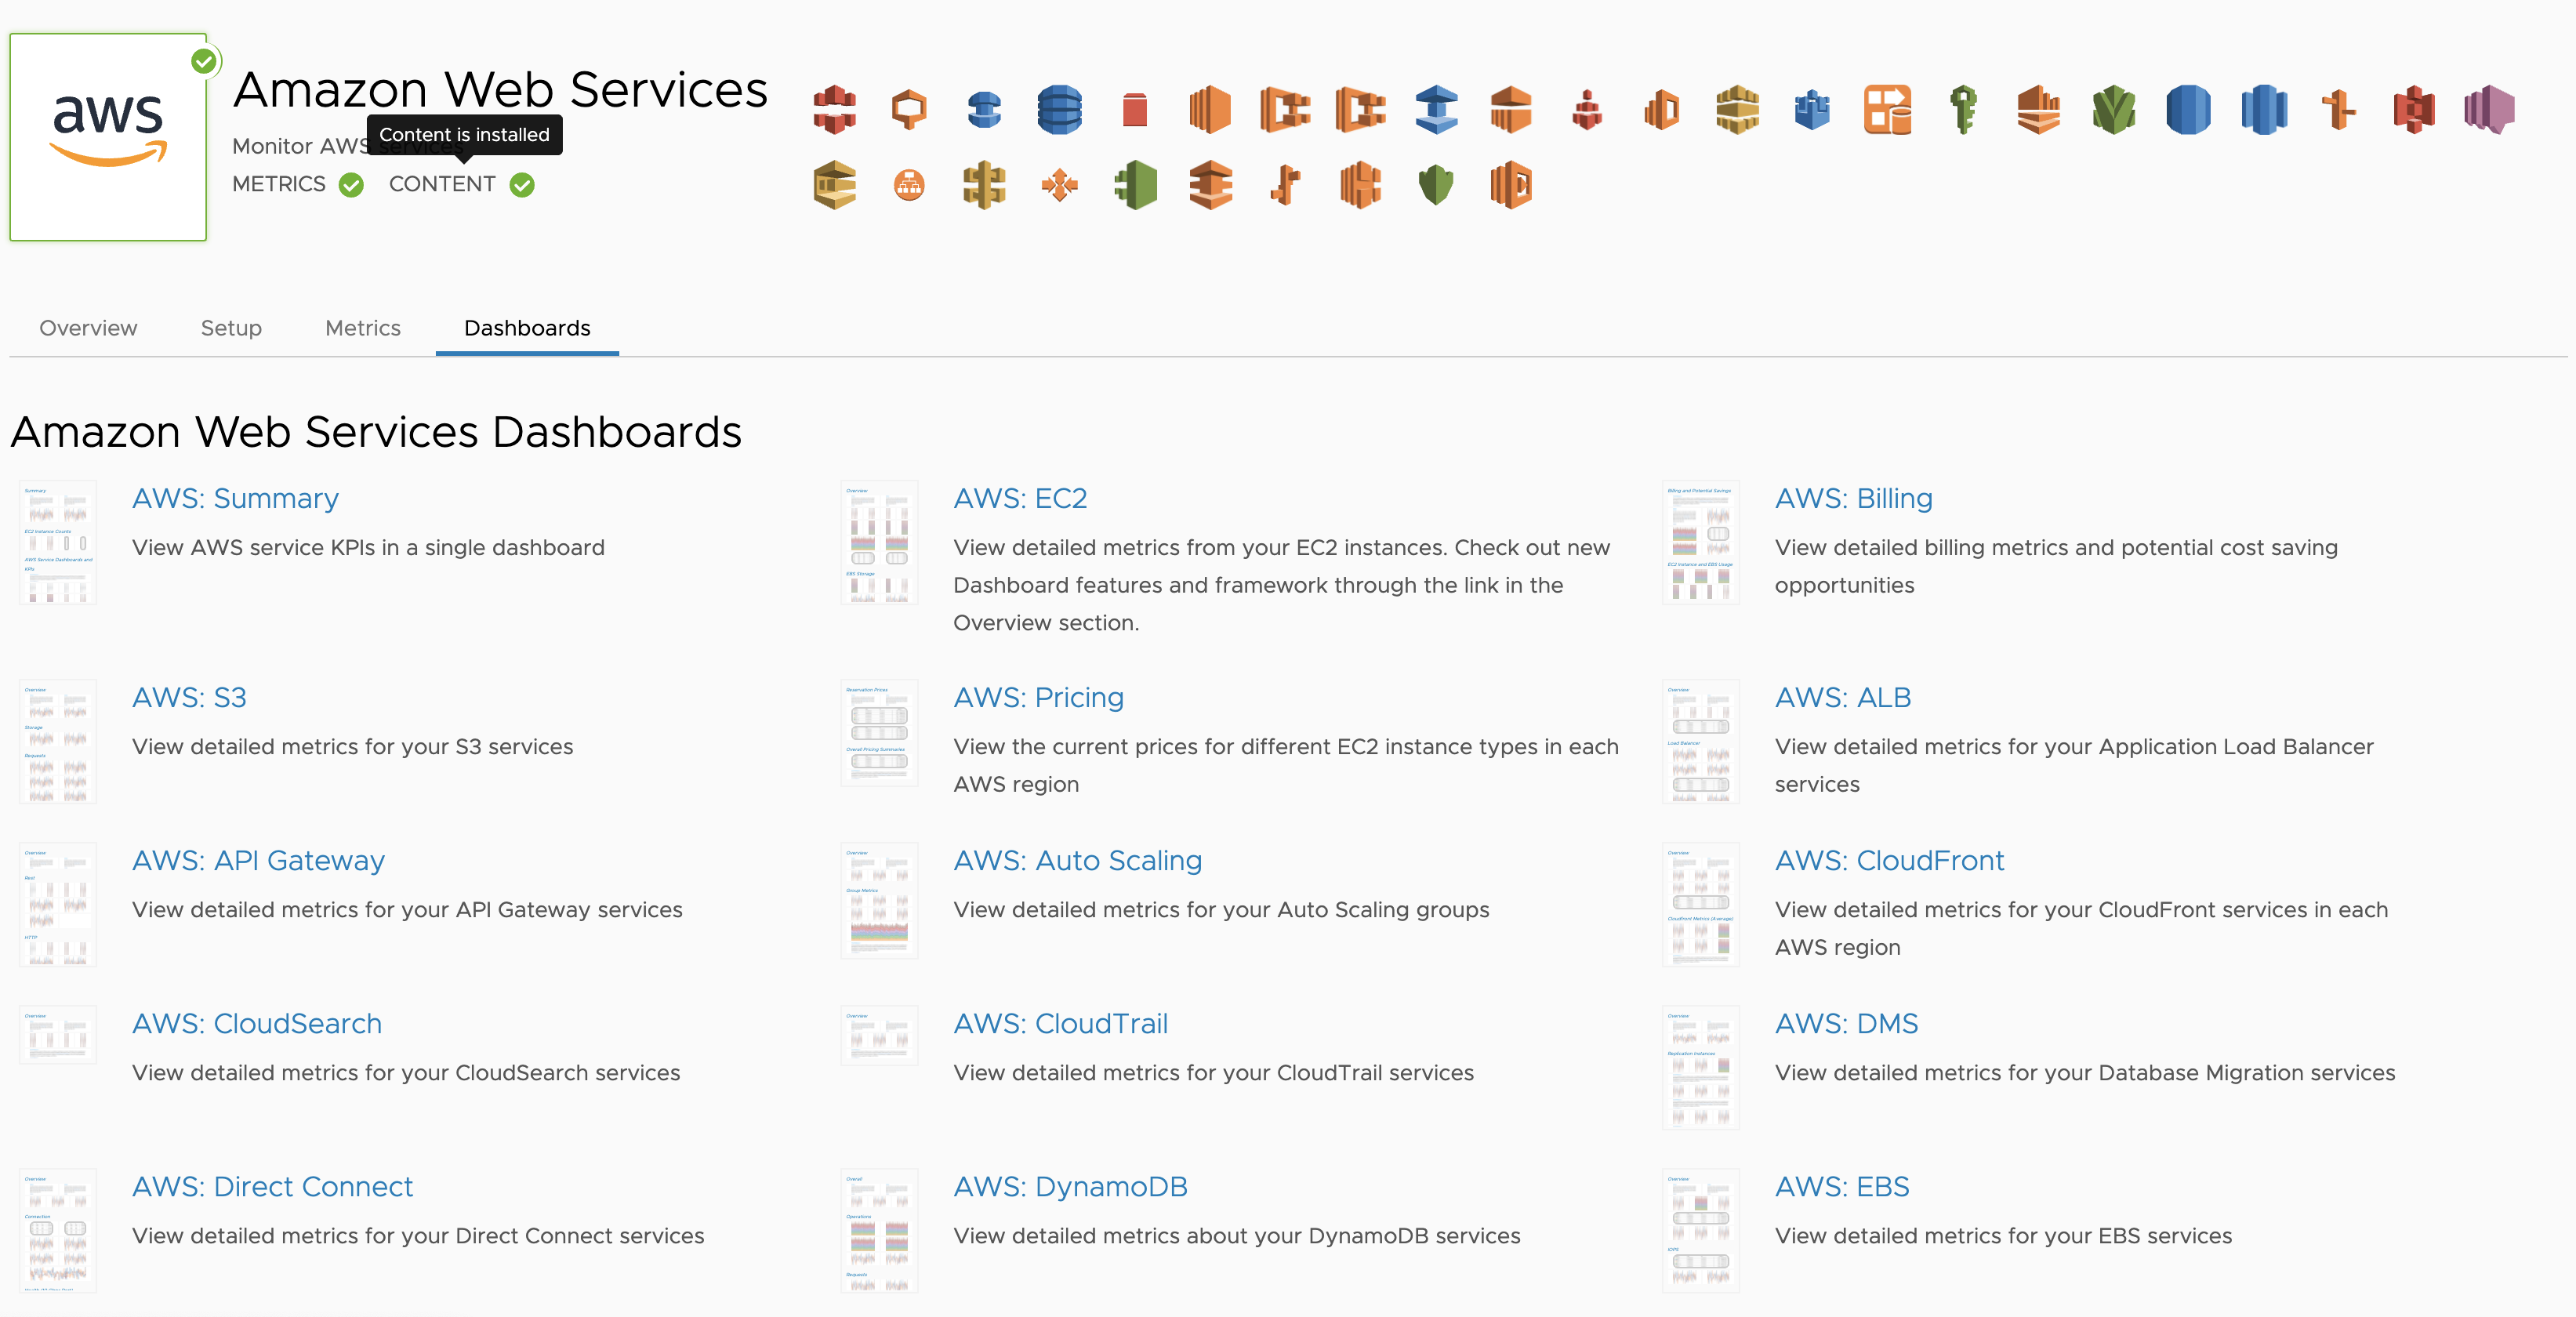
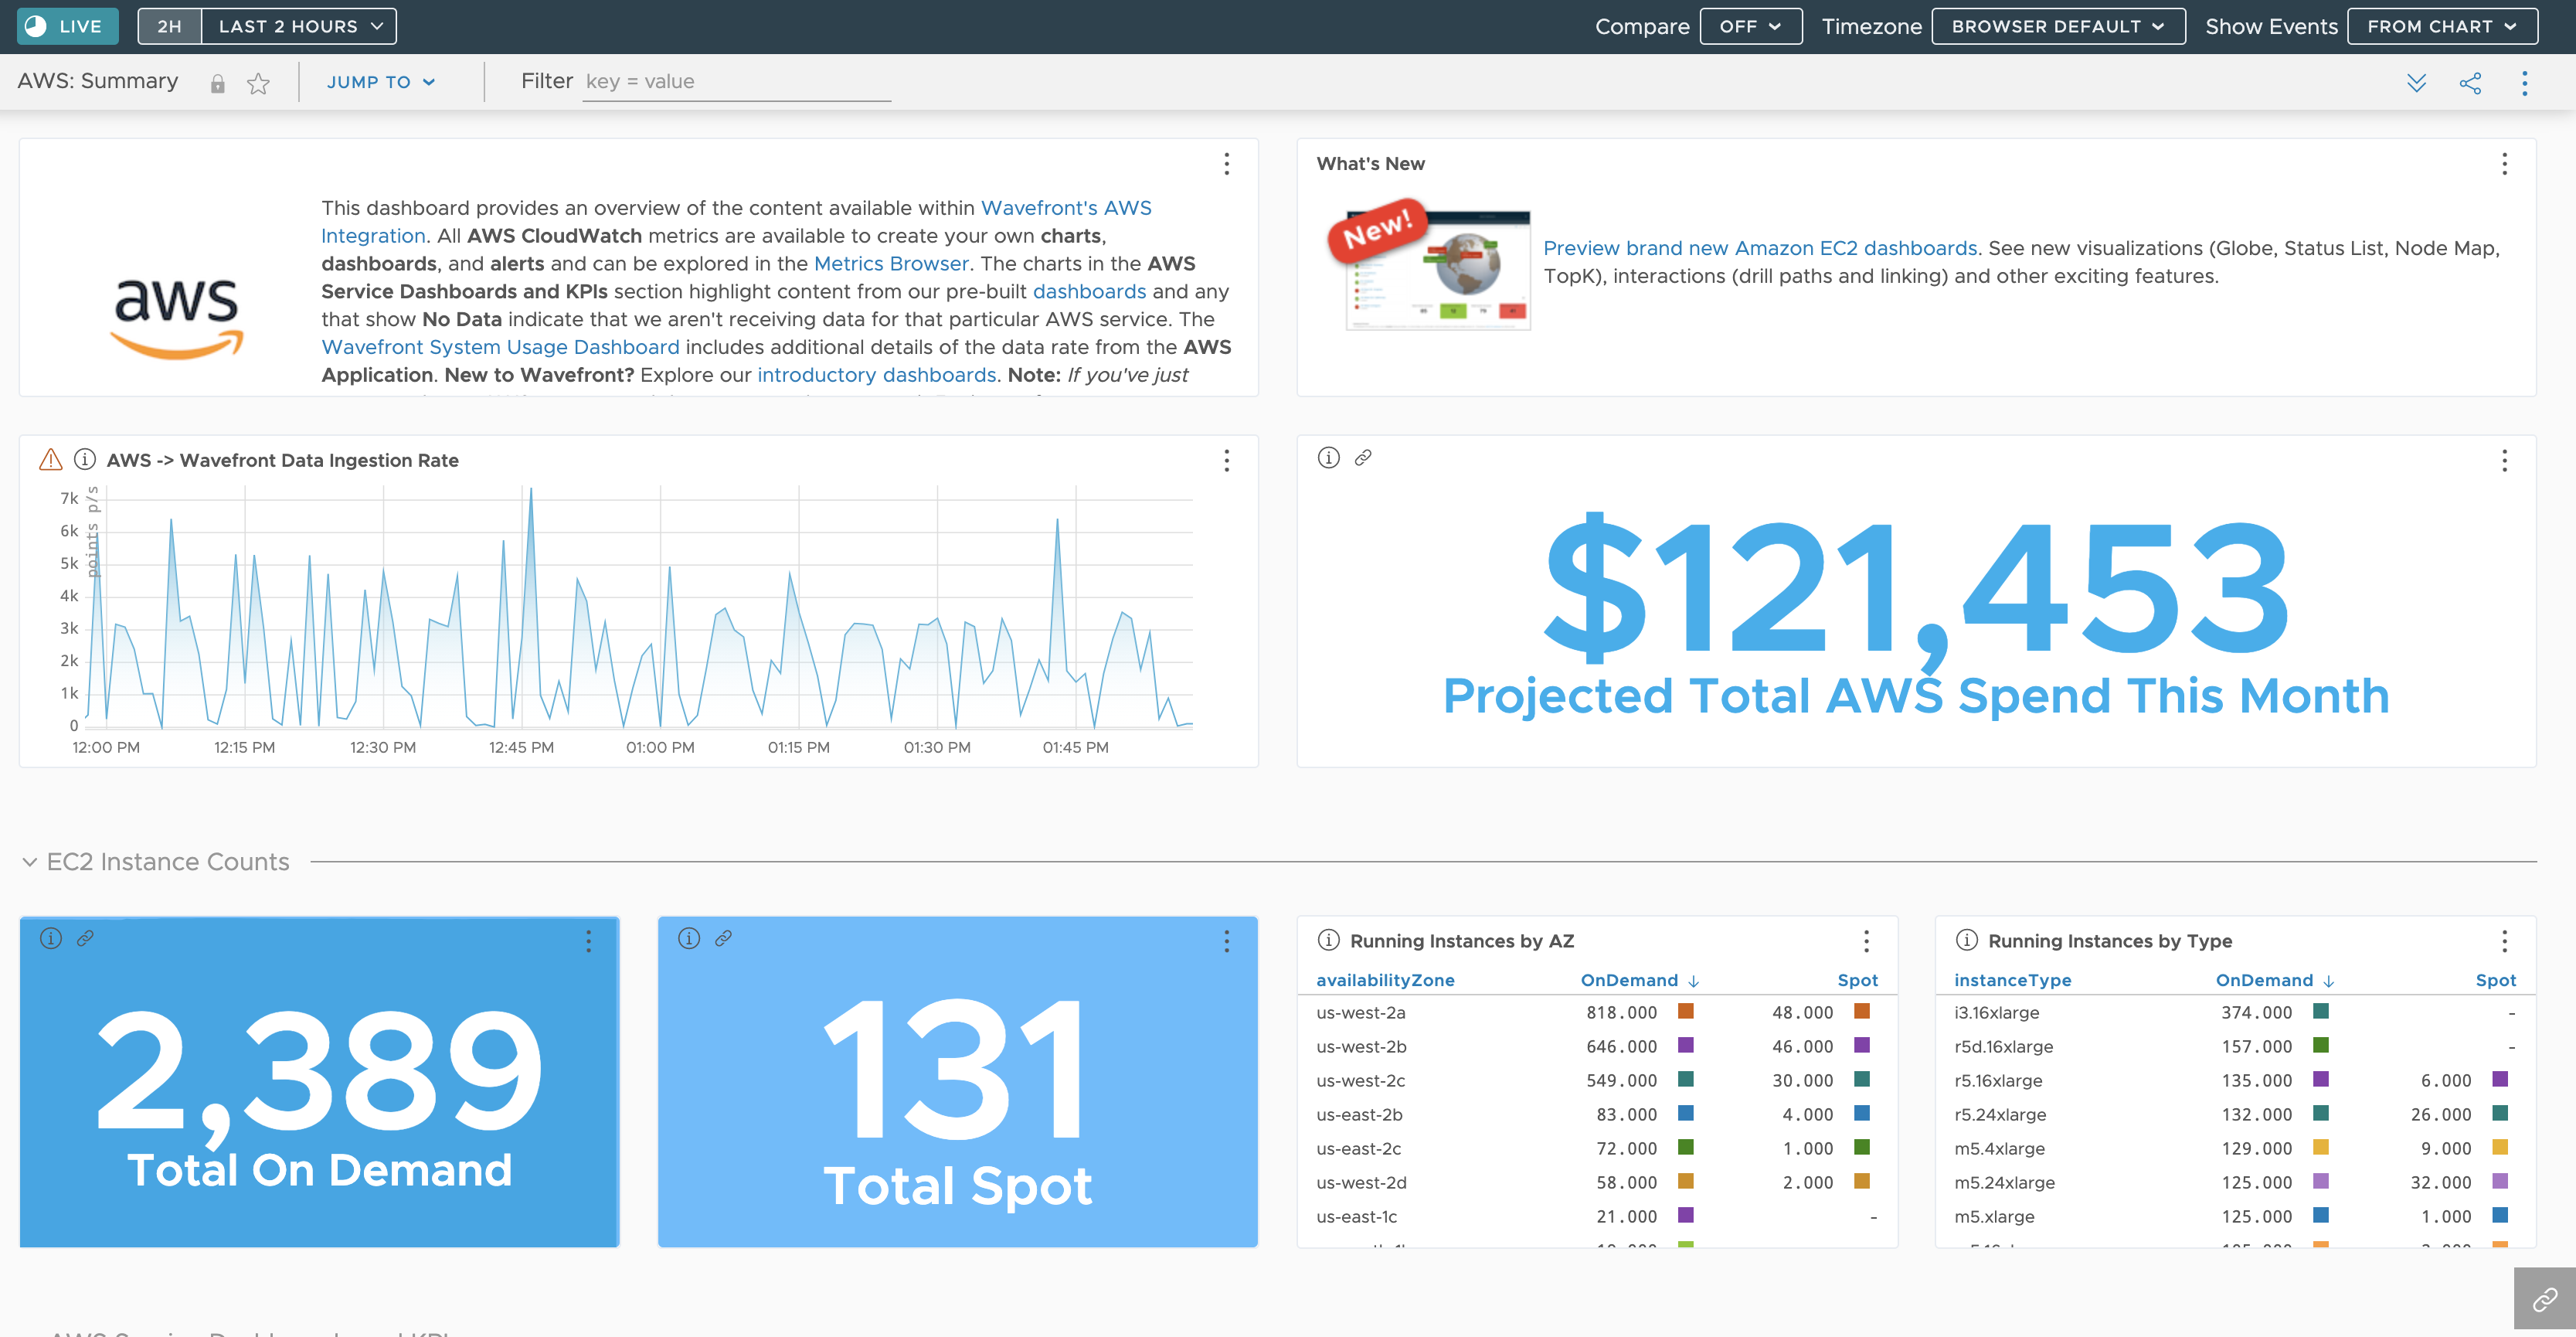
- Click AWS: Summary. From the Summary dashboard, you can easily navigate to all other AWS dashboards.
Note: You need to configure your AWS account preferences to send billing metrics. See Configuring CloudWatch Billing Metrics.
Learn More About Dashboards and Charts
This 90-second video gives a great overview of how to interact with dashboards and charts.
Note that this video was created in 2020 and some of the information in it might have changed. It also uses the 2020 version of the UI.
Task 3: Set Up and Use an Out-of-the-Box Alert
Many integrations have preconfigured alerts for common use cases. All you have to do is:
- Clone the alert.
- Edit the thresholds (for most alerts).
- Specify who should receive the alert notification, i.e. the recipient of the alert.
|
1. Navigate to the Integrations page.
2. Click the integration that you want to use. A configured integration has a green tick in the top right. |
 |
|
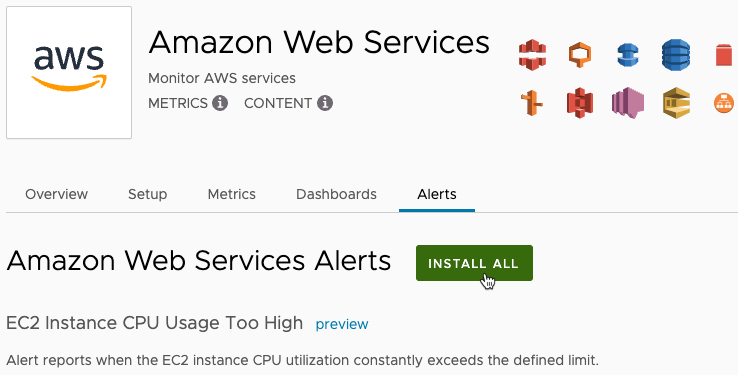
3. On the Alerts tab, click Install All. Here's an example screenshot from the AWS integration. Not all integrations have preconfigured alerts. You can now edit the alert directly, but we recommend that you clone the alert so you don't lose your changes in case you reinstall the alerts. |
 |
|
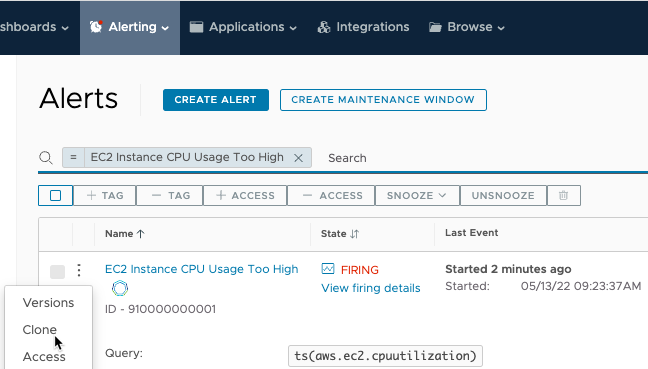
4. From the toolbar, select Alerting > All Alerts and search for the alert by name.
In this example, we'll clone the EC2 Instance CPU Usage Too High alert. When you clone the alert, the new alert opens in Edit mode. |
 |
|
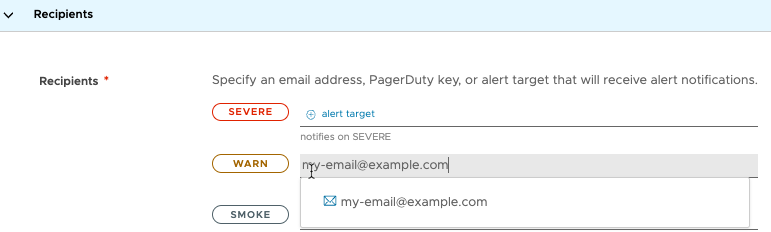
5. Customize the thresholds. For example, you can set up the alert to be SEVERE when 97% of CPU utilization is reached. 6. Scroll down to the Recipients section. For the lowest severity level that you want notification for:a. Click the plus (+) icon. b. Enter your email address. c. Press Enter. |
 |
|
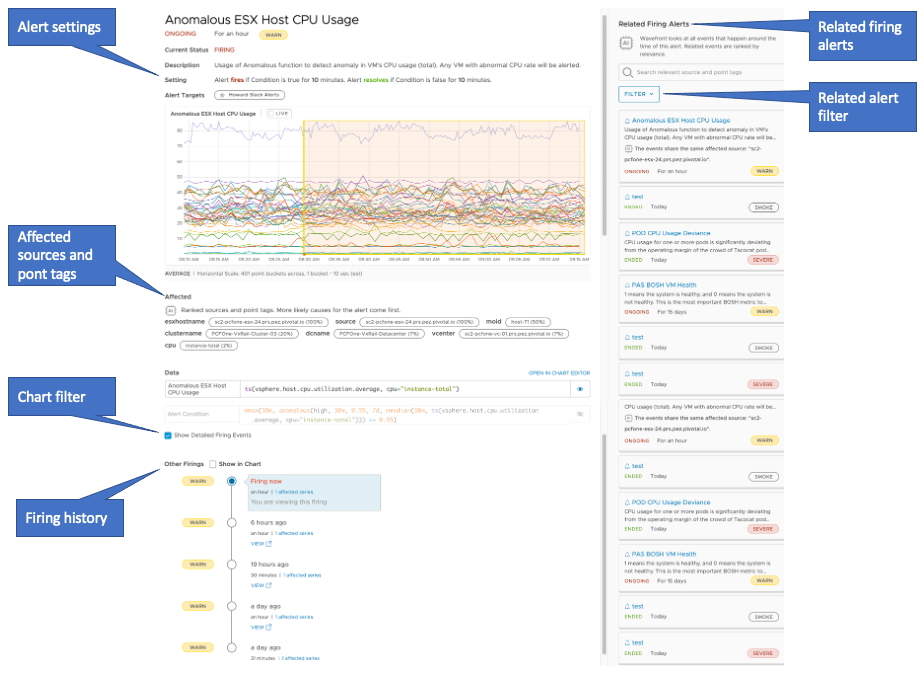
When the threshold is exceeded, you'll receive an email that includes a link to the alert in the Alert Viewer. The annotated screenshot on the right can help you get started with the Alert Viewer. This short video shows what you can do. Note that this video was created in 2019 and some of the information in it might have changed. It also uses the 2019 version of the UI. |
 |
Learn More About Alerts
- How Alerts Work & Tutorials for Alert Viewer and Alerts Browser
- Create and Manage Alerts
- Alerts FAQs
Frequently Asked Questions
Our Success Value Engineering team shared some frequently asked questions – and where you can find the answers.
- How do I manage my account (permissions, preferences, etc.)? See Customize Your Account.
- How can admins add other users? See Manage User Accounts.
- How do admins set up SSO? See Single-Tenant Authentication and Self-Service SAML SSO
- How do I track usage? See Monitor Your Service with the Operations for Applications Usage Integration.
- Why did my alert (not) fire? See Why Did My Alert Not Fire? and Why Did My Alert Misfire.
- How do I contact support? See Support and Feedback.
- Do you have videos? Yes! We have a video channel on VMware TV!