My Logging Solution Doesn’t Use the Default Attributes
You can use the proxy configuration properties to map attributes your logs are using to attributes our logging solution expects, as follows:
| Expected log attribute | Proxy property to change the attribute |
|---|---|
| timestamp | customTimestampTags |
| message | customMessageTags |
| application | customApplicationTags |
| service | customServiceTags |
Why Don’t I See Logs When I Drill Down From a Chart?
If you right-click on a chart and select Logs, you’re directed to the Logs Browser. If you don’t see data on the Logs Browser, here are some things to explore:
- If your chart has data from more than one source and you didn’t select the target source, the Logs Browser cannot show the logs because this feature shows logs from only one source. To see the data corresponding to the chart query but focused on one source, select a source in the Logs Browser and click Search.
- If you have not tagged your log data using the corresponding source value when you sent the logs from your log shipper, you might see no search results in the Logs Browser. See What’s a Log? for details on the log syntax.
Why Are Some of the Logs Tags Missing?
Our logging solution expects that certain tags are defined in the logs that you send in.
You can use proxy configuration properties to map the tags that your log shipper is using to the tags that our solution expects. See Logs Proxy Configurations and Preprocessor Rules.
- There may be a marginal cost increase for additional tags.
-
If you're using our distributed tracing, use the same
applicationandservicetags in both places to map from the tracing GUI to the Logs Browser.
If you are using Fluentd, you can specify the application and service in the fluent.conf file as follows:
<filter **>
  @type record_transformer
  enable_ruby
  <record>
    service "<INSERT_YOUR_SERVICE_HERE>"
    application "<INSERT_YOUR_APPLICATION_HERE>"
    #source "#{ENV['MY_NODE_NAME']}"
    timestamp ${time.to_datetime().strftime('%Q')}
  </record>
</filter>
How Do I Track Data Blocked by the Wavefront Proxy?
Use the methods listed below to track the incoming log data and the number of logs blocked by the proxy:
See the Data on the Predefined Logs Stats Charts
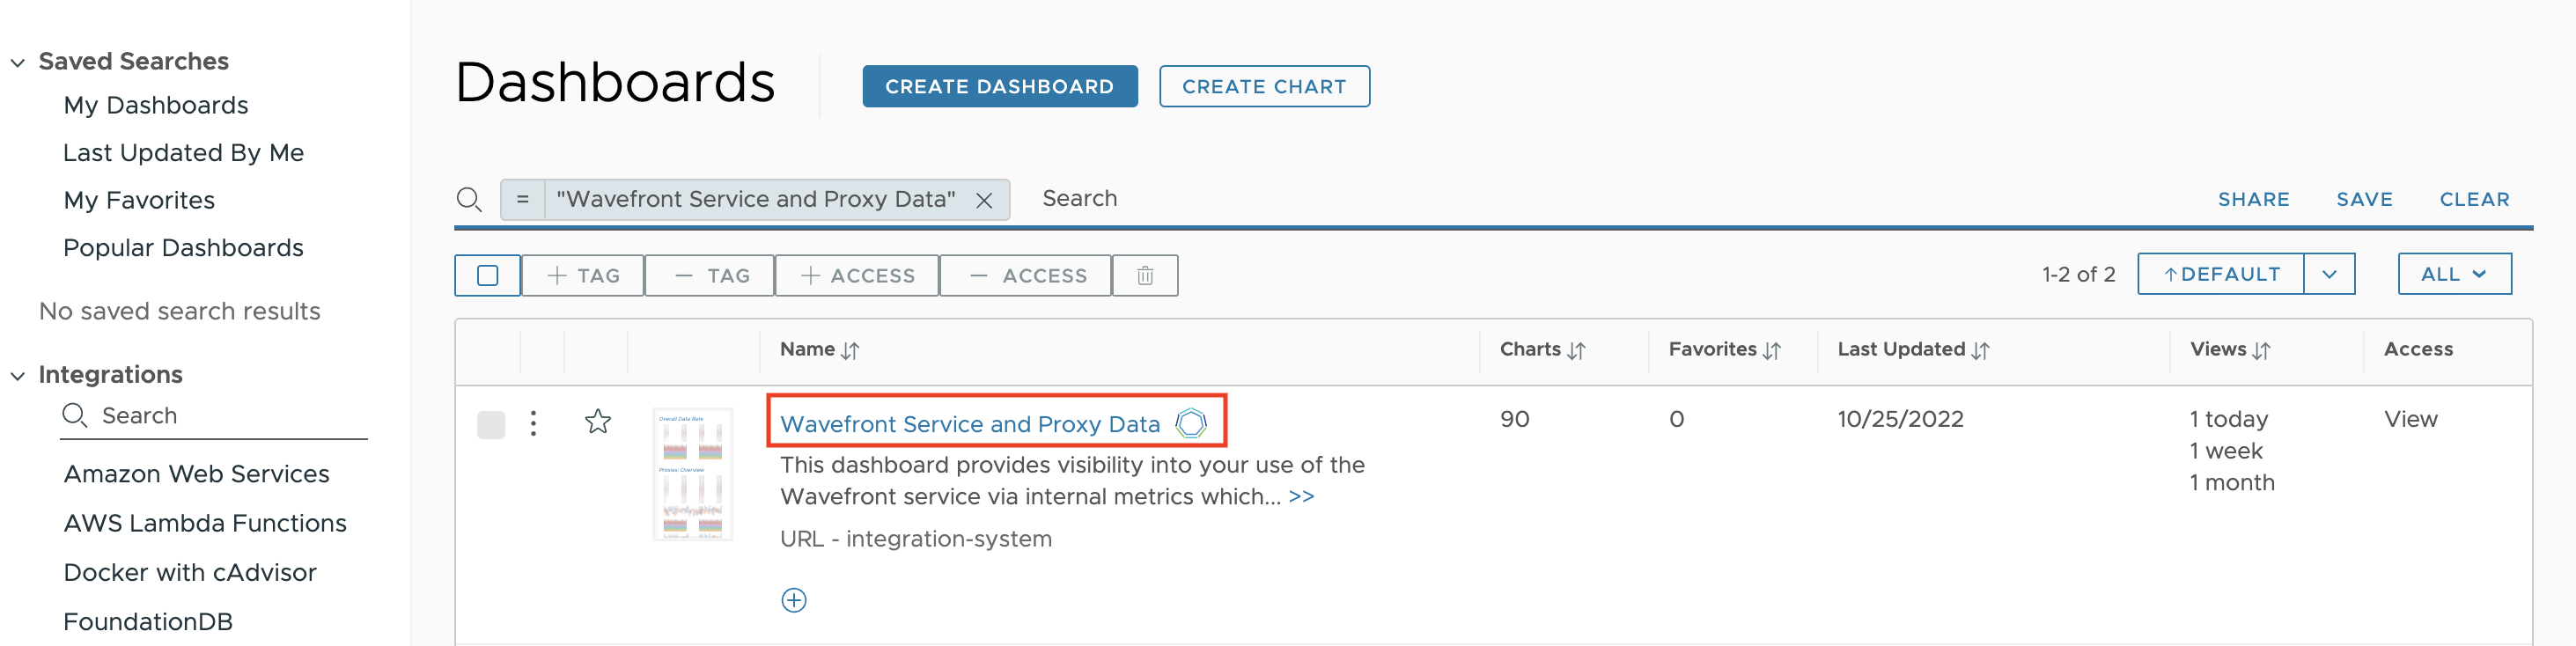
- Select Dashboards > All Dashboards.
- Search for Operations for Applications Service and Proxy Data in the search bar, and click the dashboard.
-
Examine the charts in the Logs Stats section of the Operations for Applications Service and Proxy Data dashboard to get details about the logs you are sending.
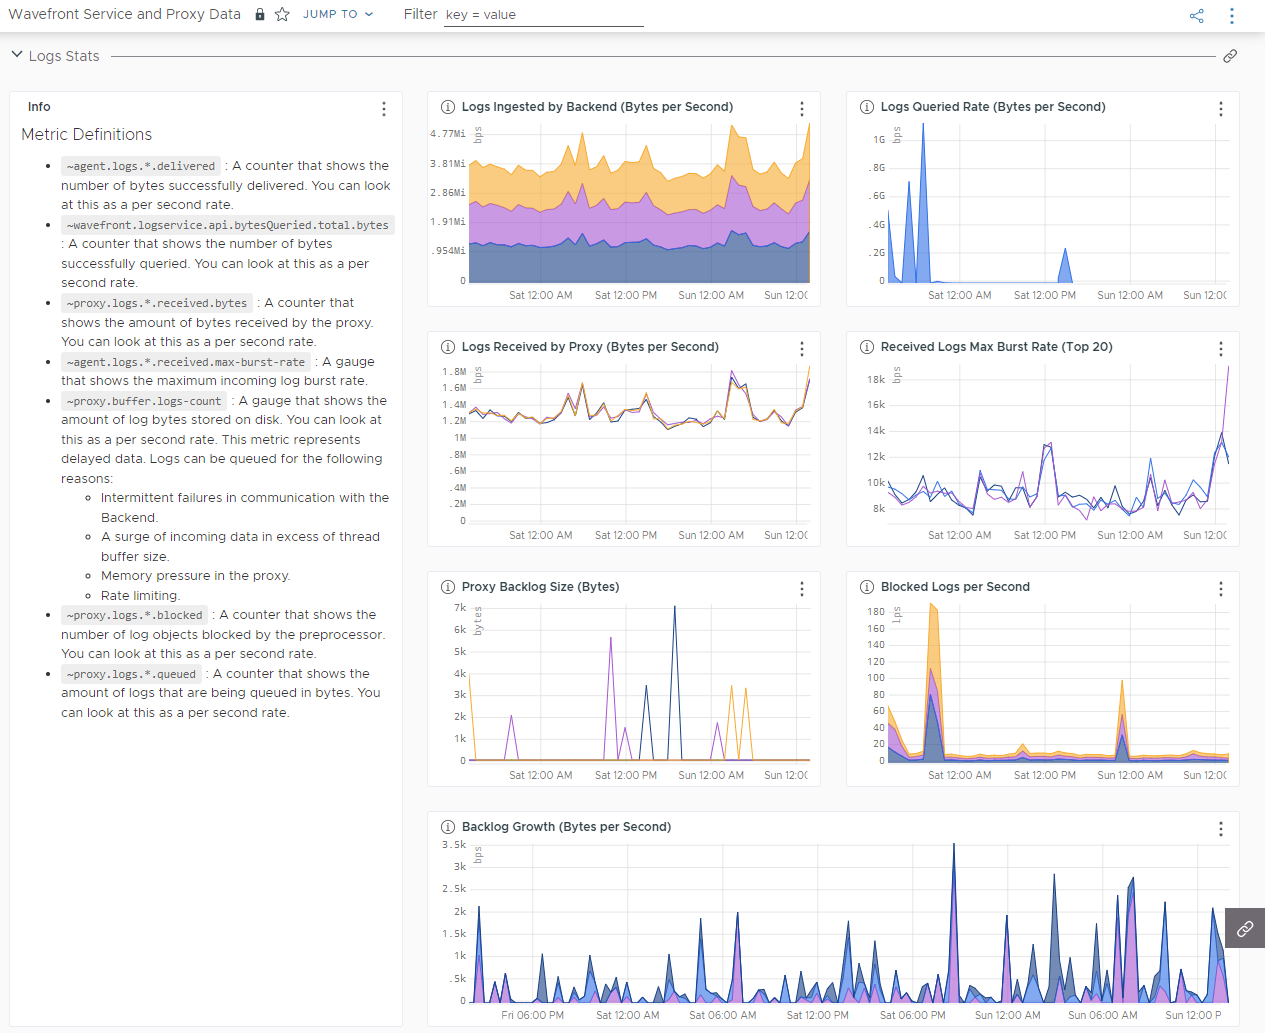 Note: To learn more, see Examine Data with Dashboards and charts.
- In the Blocked Logs per Second chart, you can see how many logs were blocked.
- In the Proxy Backlog Size (Bytes) chart, non-zero values indicate that the proxy is having issues delivering data.
Search for Metrics on the Metrics Browser
- Select Browse > Metrics.
- In the Metrics Browser, search for metrics with the
~proxy.log.namespace. The results you see can belogAnnotationValueEmpty.
Search for Logs on the Proxy Log Files
By default, the proxy logs entries are logged in the wavefront.log file. For details, see Proxy Log Files.
In the proxy log entries, search logs containing the following message:
INFO [AbstractReportableEntityHandler:reject] [2878] blocked input:
You can see why the log was rejected and the log message.
Why Do I See a pattern not match Error in the Fluentd Logs?
If your application runs on a Kubernetes cluster, and if you see a pattern not match error in the Fluentd logs, Fluentd scrapes the logs on your application but does not send them to the Wavefront proxy. Add the following configuration to your fluent.conf file to resolve the pattern not match error:
<pattern>
  format regexp
  expression /^(?<time>.+) (?<stream>stdout|stderr)( (.))? (?<log>.*)$/
  time_format '%Y-%m-%dT%H:%M:%S.%NZ'
  keep_time_key false
</pattern>
How Do I Know If the Proxy Receives Data?
If you don’t see your data on the Logs Browser, you might not know if there’s a problem with the log shipper or with the Wavefront proxy.
To confirm that the Wavefront proxy is sending data, follow these steps:
-
Run the following curl command to send a log to the proxy as a JSON payload:
 curl --location --request POST 'http://<Proxy_Host>:<Proxy_Port>/logs/json_array?f=logs_json_arr' \
 --header 'Content-Type: application/json' \
 --data-raw '[
     {
         "message": "test message",
         "source": "localhost",
         "application": "test_application",
         "test_label": "label1"
     }
 ]'
Tip: For information on the log format, see What’s a Log?For example, use the following command if you are running the proxy locally and using port 2878:
 curl --location --request POST 'http://localhost:2878/logs/json_array?f=logs_json_arr' \
 --header 'Content-Type: application/json' \
 --data-raw '[
     {
         "message": "test message",
         "source": "localhost",
         "application": "test_application",
         "test_label": "label1"
     }
 ]'
Note: If you get the following error message: Failed to connect to localhost port 2878: Connection refused, the problem is likely that the proxy is not running. -
Verify that the data that is sent from the log shipper to the proxy is then sent by the proxy to our service, as follows:
- On the toolbar, click Logs.
- In the Logs Browser, click applications under All Tags.
- Click test_application (or the value of the application tag in the log message you sent).
- If the proxy is sending data but you don’t see your log data, check that the log shipper is configured correctly.
- If you don’t see the data, check your proxy configuration and ensure, for example, that the port and URL are correct.