The Traces Browser in VMware Aria Operations for Applications (formerly known as Tanzu Observability by Wavefront) lets you explore the context and the details of your application’s traces.
Video
This video highlights the Traces Browser features and settings. Note that this video was created in 2019 and some of the information in it might have changed. It also uses the 2019 version of the UI.
Explore the Traces Browser
See the Traces Browser:
- Option 1:
- Log in to your service instance.
- From the toolbar, select Applications > Traces.
- Option 2:
- Log in to your service instance.
- Drill down to the Traces Browser from the Service Dashboard, application map, table view, or grid view.
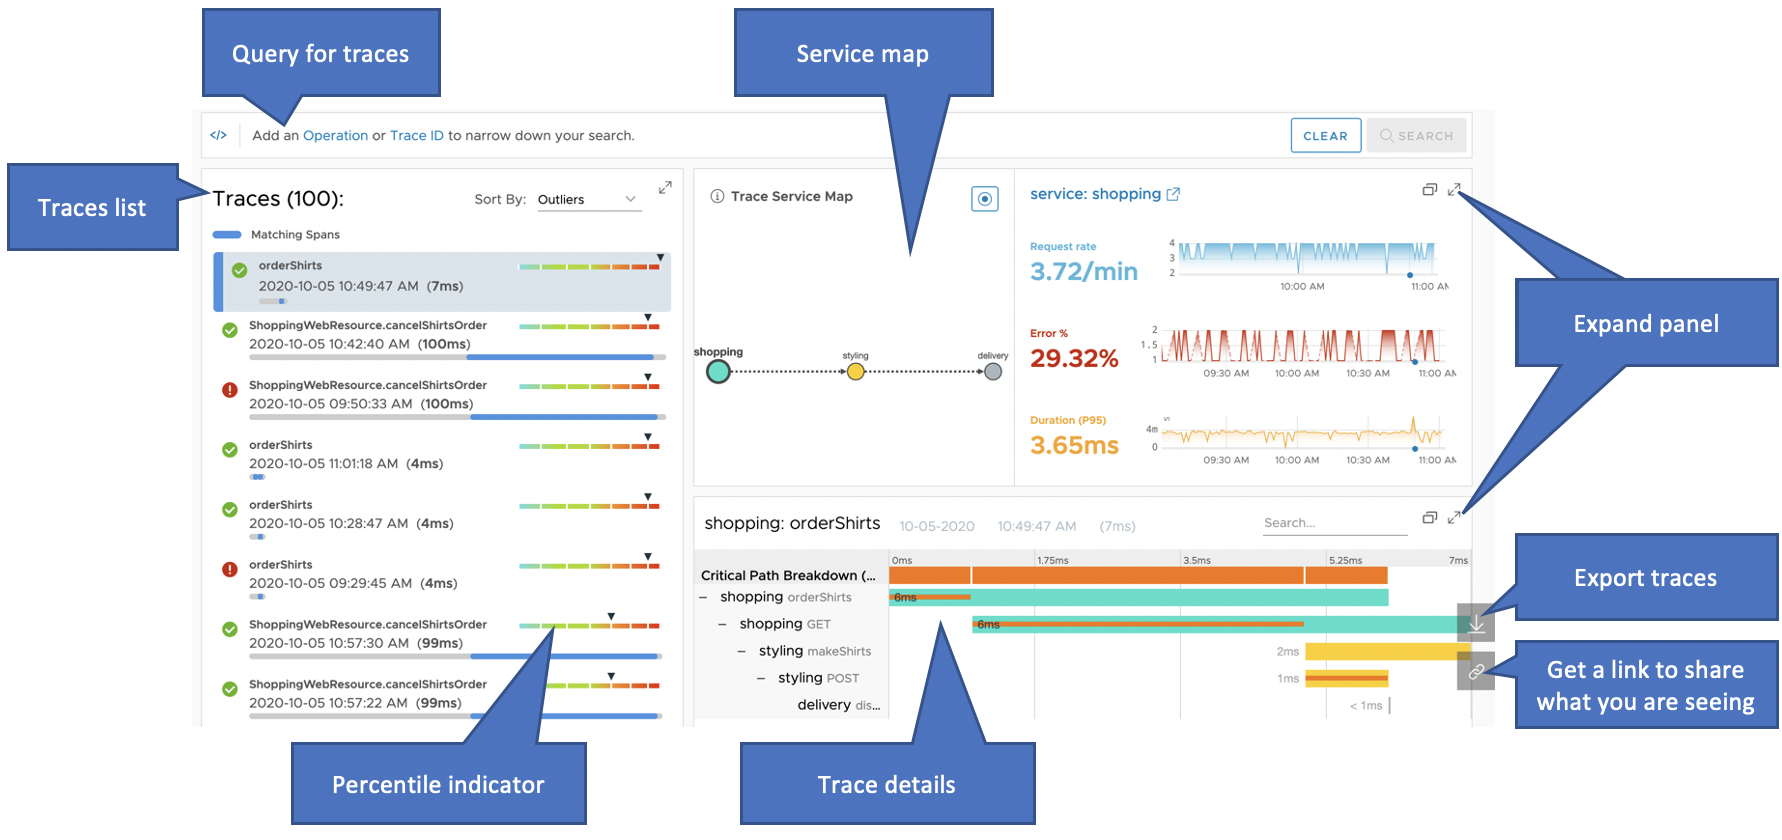
From the Traces Browser, you can:
- Query for traces and view the query results in the traces list.
Note:
- When you search for a Trace ID, the search now returns results regardless of the selected time window.
-
If you enabled the traces browser to show live (
 ) results, the results get updated every 5 minutes with the latest traces.
- Select a trace in the list and:
- Use the service map panel to investigate the services that contribute spans to the trace.
- Use the trace details panel to examine the individual spans in the trace.
- Examine a trace’s percentile indicator to see how the trace’s duration compares to the durations of the other listed traces. You can toggle the panel size for the traces list, service map, or trace details.
- Export traces by clicking
 , save the JSON file, and view them later using Offline Traces.
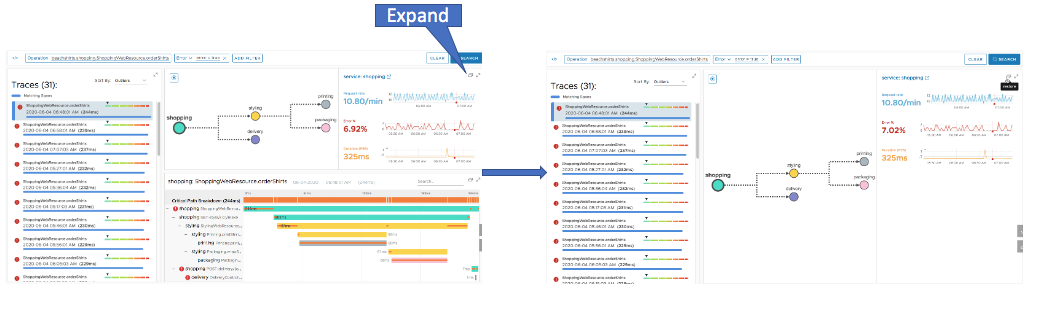
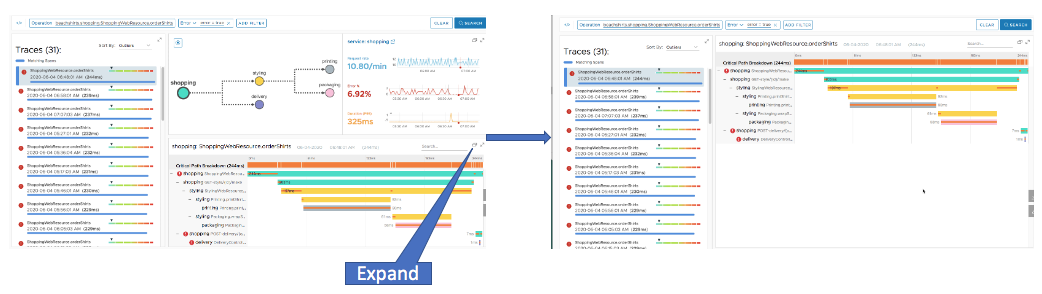
 - Easily analyze your traces hierarchy and RED metrics by clicking the expand or restore icon.
- Click the expand icon to expand the RED metrics and view them next to the trace list, and click the same icon again to restore to the default view.
- Click the expand icon to expand the trace hierarchy and view them next to the trace list, and click the same icon again to restore to the default view.
- Click the expand icon to expand the RED metrics and view them next to the trace list, and click the same icon again to restore to the default view.
- Use the link icon
 to get a link and share what you’re seeing right now (NON-LIVE display) with other users.
Query for a List of Traces
In the Traces Browser, you can use the query builder or query editor to query for traces that include spans for a particular operation.
You can view the results in a traces list.
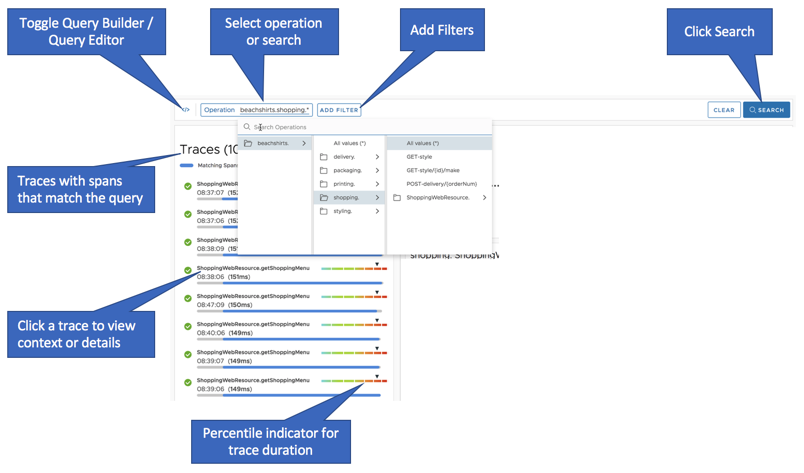
Here’s how to get started:
- Add an Operation or Trace ID. See Get Started with Trace Queries for details.
- Click Add Filter and specify a filter to limit the results.
- (Optional) Advanced users can use Query Editor to limit the scope even further.
You can use the trace list to:
- Sort the returned traces according to different criteria.
- Click a trace to view its context in the service map panel and its details in the trace details panel.
- View a trace’s percentile indicator to see how the trace’s duration compares to the durations of the other listed traces – and potentially find outliers.
Investigate the Service Map for a Trace
In the Traces Browser, use the service map to investigate the services that contribute spans to a selected trace.
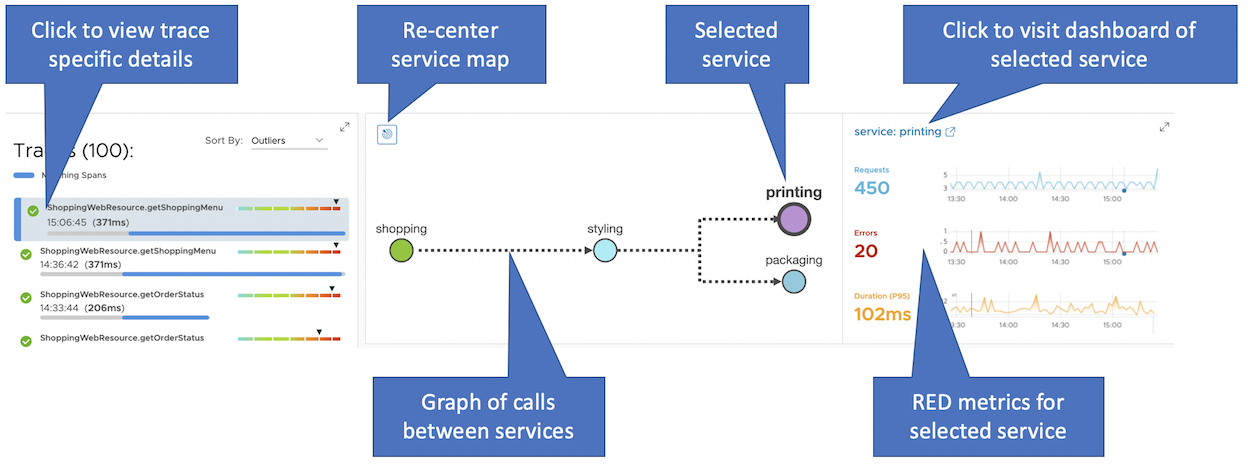
In the service map panel, you can:
- View the service dependencies, and follow the flow of request calls from service to service.
- Click on a service to display the RED metrics that reflect the health of the service:
- Request count, error count, and trace duration at the 95th percentile, over all traces (root spans) that originate in the service.
- Line charts that indicate the general contour of the RED metrics.
- Fine-tune the time window of the RED metrics charts, and see events.
- Navigate to the selected service’s dashboard for more service details.
- Scroll the service map to zoom in or out, and re-center the service map.
- Look for nodes that are grayed out. These represent services that contribute spans to at least one trace in the list, but not to the trace that is currently selected.
Examine Trace Details
In the Traces Browser, use the trace details panel to examine the spans that belong to a selected trace. Some of these spans may represent operations executed by other services.
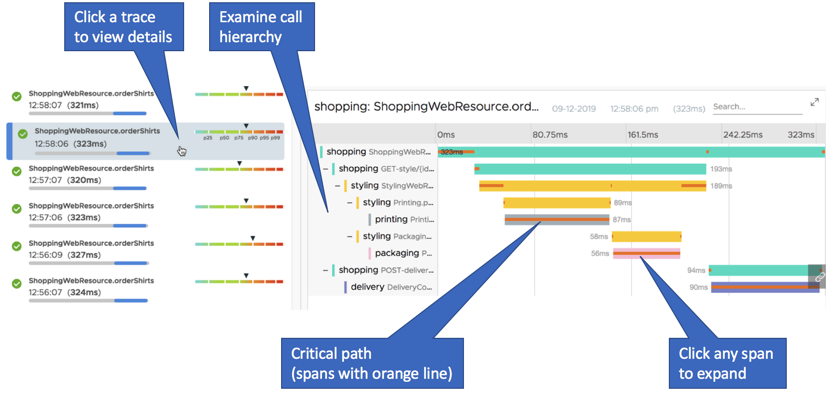
In the trace details panel, you can:
- Examine the call hierarchy for a selected trace.
- Click any span to expand and see more detail.
- Explore the trace’s critical path. This is an end-to-end sequence of blocking spans, where each blocking span must complete before the trace can complete.
Drill Down Into Spans and View Metrics and Span Logs
In the trace details panel, you can view details about a particular span in the trace. If that span came from another service, you can navigate to the dashboard for that service.
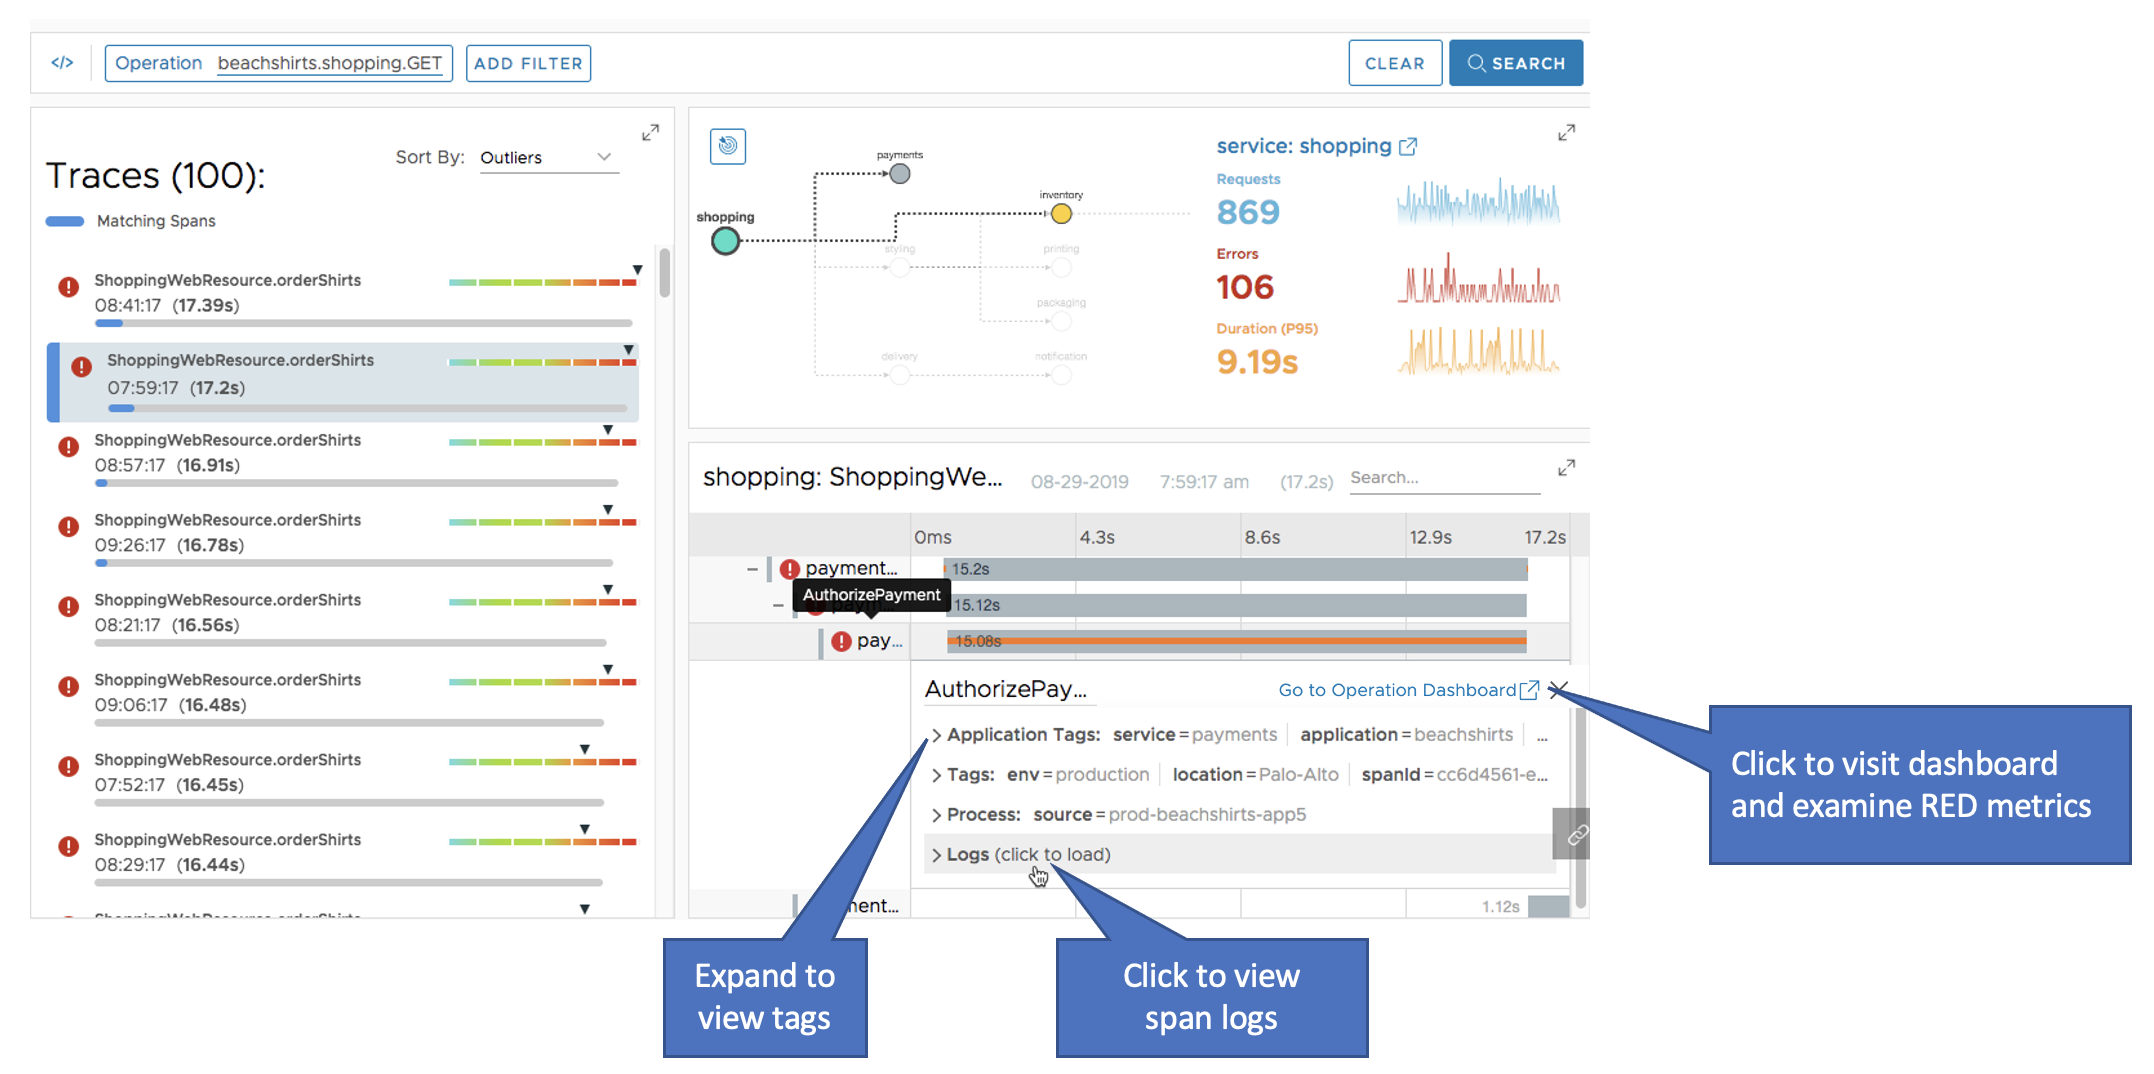
Span details include:
- Application tags. These are the application, service, cluster, and shard, as selected by the trace query.
- Other tags, including the trace ID.
- A clickable link to the corresponding Operation Dashboard that lets you examine the RED metrics associated with the call.
If your spans have been instrumented to show span logs, you can click Logs to fetch the logs and drill down to examine them. We don’t show span logs by default for better browser performance.
Drill into Logs from Traces
If you notice a critical path through a trace in the Traces Browser, you can drill down into the related logs.
To see the logs for a trace:
- Click the trace that you want to examine.
- In the Trace Details section, click the service on which you want to focus.
- Expand the IDs section.
- Click Search Logs.

The Logs Browser opens in a new tab with the following configurations:
- By default, the search time window starts 5 seconds before the trace and ends 5 seconds after the trace.
Tip: You can customize the before and after buffer time to create a customized time window when drilling into logs from the Traces Browser. For more details, see Customize the Time Window when Drilling into Logs
- The search query contains the corresponding
traceId,source,application, andservicetag filters.
To learn more about exploring traces and about finding hot spots at a glance, see Traces Browser.
 |
A Closer Look at Critical Paths
The trace details panel uses an orange line to show the critical path through a trace. You can think of the critical path as the end-to-end combination of spans that are the most blocking. These spans represent the sequence of operations that must complete before the trace itself can complete.
Analyzing the critical path of a trace can help you determine which operations took the most time, and can help you decide which operations to try to optimize.
We use the following rules to determine which spans to include in a critical path (in order of applicability):
- Ignore asynchronous spans (spans tagged with
followFrom). - Ignore spans that end before their parent starts.
- If a child span continues after its parent, ignore that continuation period.
- Choose longer spans over shorter siblings.
- Choose later spans over earlier spans.
- Choose child spans instead of their parent spans.