VMware Aria Operations for Applications (formerly known as Tanzu Observability by Wavefront) includes the Service Dashboard, which you can use to identify potential hot spots of a service, and then drill down to the Traces Browser.
Explore the Default Service Dashboard
The default, read-only dashboard for a service lets you explore that service, however, you can’t make changes to the dashboard.
See the Service Dashboard:
- Option 1:
- Log in to your service instance.
- From the toolbar, click Applications > Service Dashboard.
- Option 2: Drill down to the Service Dashboard from the application map, table view, or grid view.
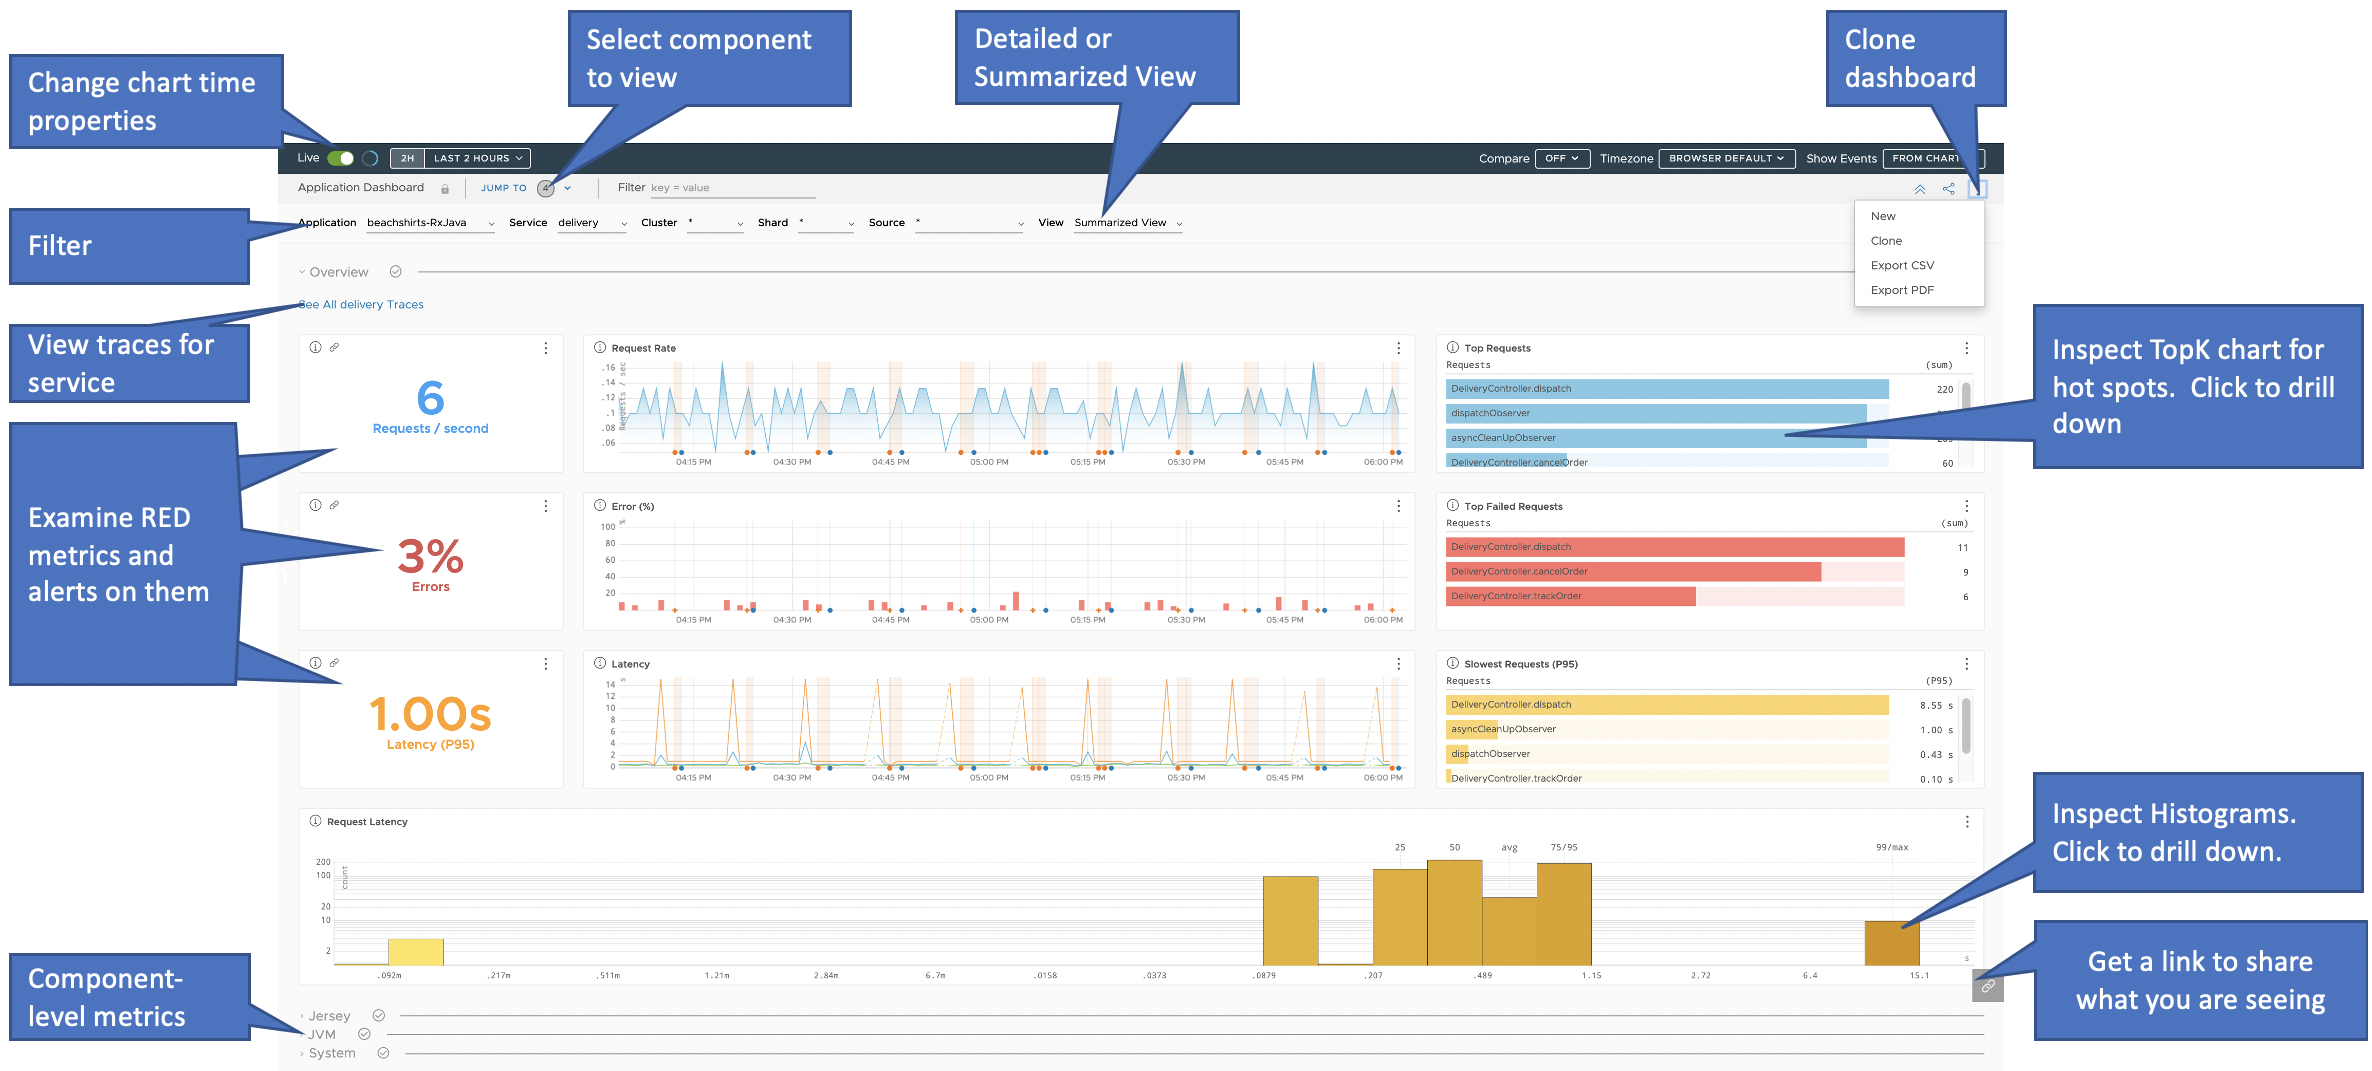
On the dashboard for a particular service, you can:
- Select the time and time zone in the toolbar to customize the chart time properties.
- Use the Jump To drop-down menu to select a dashboard section:
- Select Overview to examine the RED metrics that are derived from all of the spans for the service. These metrics reflect the health of the service.
- Select an individual component to examine metrics for just that component of the service. A component could be an instrumented framework (e.g., Jersey) or the runtime system (e.g., JVM).
- Select System if your environment uses Telegraf and you want to view CPU usage, memory usage, and disk usage.
- Filter the metrics based on the cluster, shard, or source.
- Select Detailed View or Summarized View to change the level of detail for charts.
- Examine the TopK charts to find out which operations are potential hot spots. The bars represent operations that execute in this component of the service.
- Use the link icon
 to get a link and share what you’re seeing right now (NON-LIVE display) with other users.
 - Navigate to the Traces Browser.
- Click a bar on a histogram.
- Select a region of the histogram chart and click Search Traces to view the traces for the selected duration.
- Click a bar on a TopK chart.
- Click the vertical ellipsis in the top right of any chart, click Traces, and click a service.
Note: If you don’t see Traces, check whether your metrics include
applicationandservice pointtags.
These tags are defined when you instrument your application for tracing via Application tags. If your application is already sending this data to the Operations for Applications service via the Wavefront proxy, you can add point tags using Wavefront proxy preprocessor rules.
Custom Service Dashboard
The standard dashboard for services is read-only. To create a customizable copy:
- Click the ellipsis icon and select Clone.
- In the cloned dashboard, add your own charts or customize the RED metrics charts.
After you save the clone, click Dashboard on the toolbar and search for your dashboard by its name. You can use it to drill down to the Traces Browser.
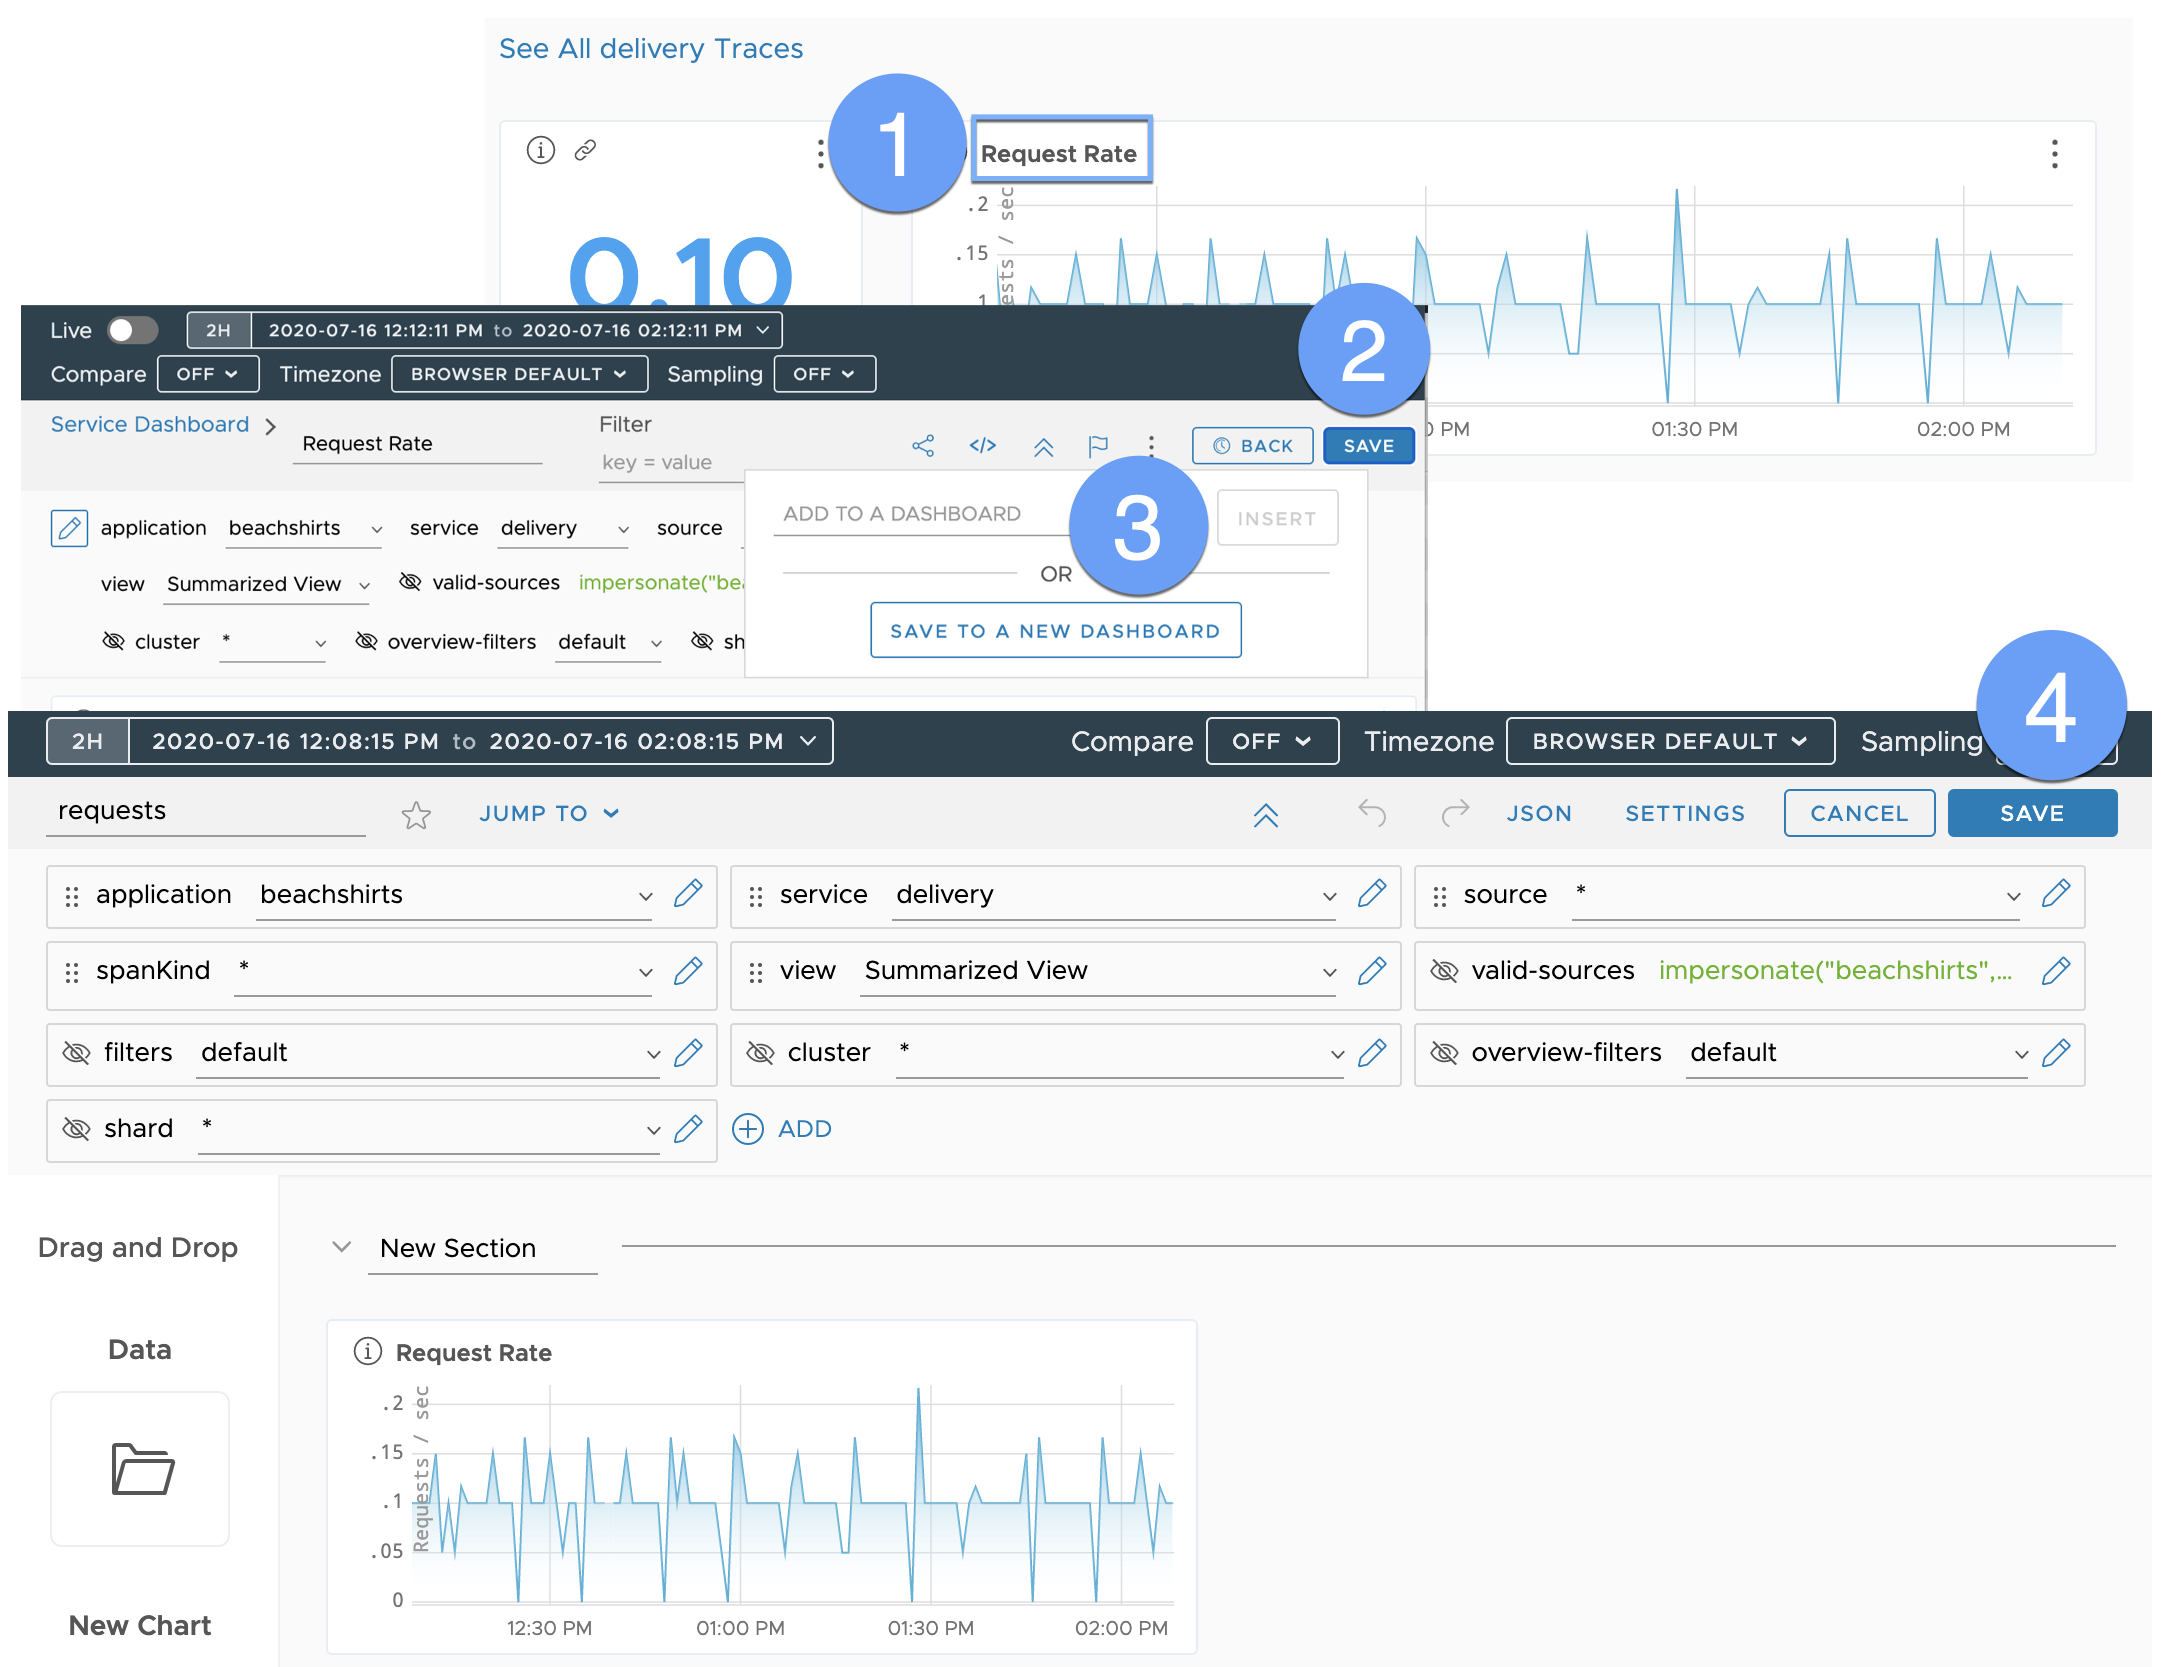
Save Charts in the Service Dashboard
View queries used in the charts of the default Service Dashboard and save these charts to your dashboard.
|
|