This doc page looks at possible causes for problems you might encounter with your Tanzu Application Service (TAS) to Tanzu Observability integration and explains how to address them.
Sizing and Scaling for Large TAS Foundations
Larger TAS foundations are more demanding to monitor than smaller foundations.
- If more application instances are running on a foundation, then more container-level metrics have to be collected and forwarded to Tanzu Observability.
- If more virtual machines are in a foundation, then more VM-level metrics are reported.
If your foundation is large, tune the following parameters, in this order:
- Increase the size of your Telegraf Agent Virtual Machine. The Telegraf agent is responsible for collecting metrics and transforming them into the Wavefront data format. The is typically CPU and memory bound, so increasing virtual machine size can increase performance.
- Increase the scrape interval. If collection times for some scrape targets are greater than 12 seconds, consider changing the scrape interval for your environment to a lower frequency. Typically, 120% of the longest observed collection time is safe.
Using the Nozzle Successfully with Service Broker Bindings
Support for service broker bindings differ for different versions of the Tanzu Observability by Wavefront Nozzle:
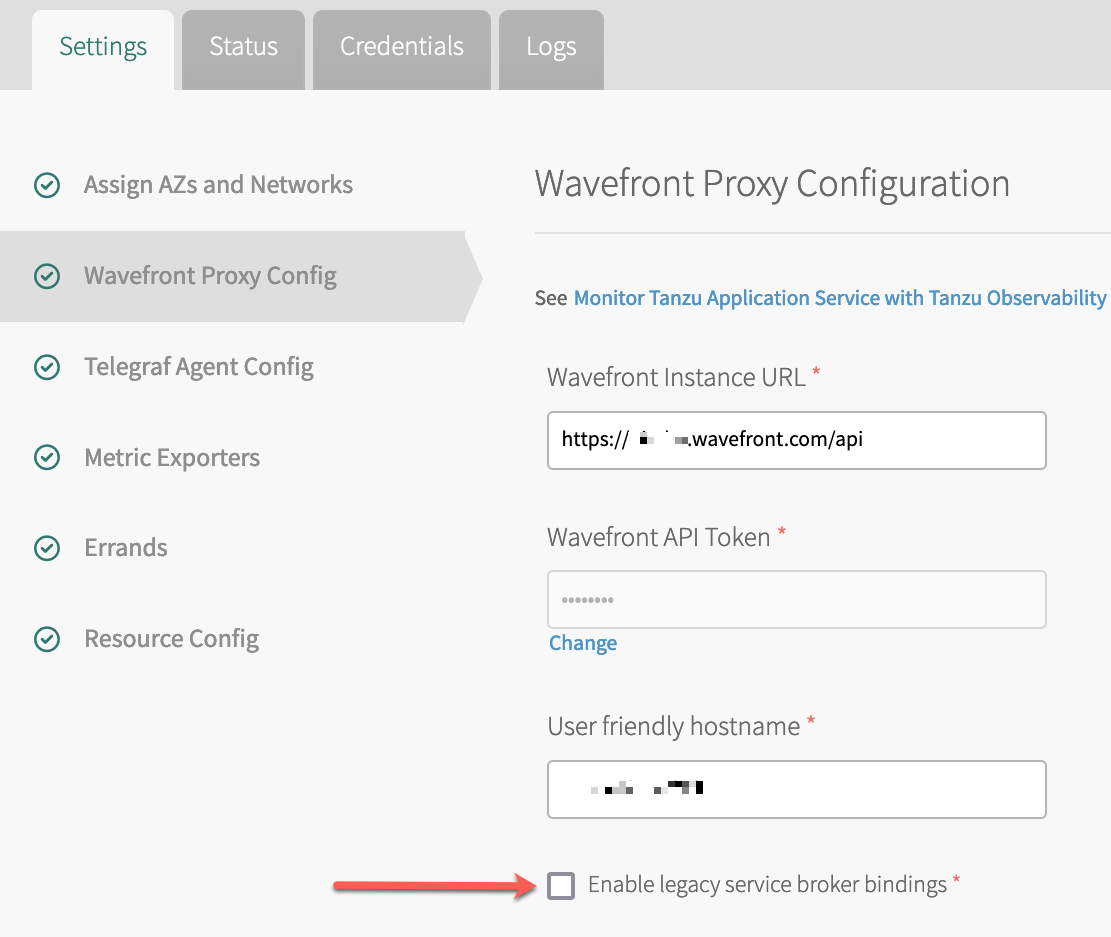
- The Tanzu Observability by Wavefront Nozzle v4.1.1 supports Service Broker Bindings. When you configure Nozzle 4.1.1, select Enable legacy service broker bindings on the Wavefront Proxy Config tab. See Install Nozzle 4.1.1 and Enable Service Broker Bindings.
- The Tanzu Observability by Wavefront Nozzle v4.1.0 DOES NOT support Service Broker Bindings. If you upgraded to nozzle 4.1.0, you have to:
- Downgrade from Tanzu Observability by Wavefront Nozzle v4.1.0 to Tanzu Observability by Wavefront Nozzle v3.
- Upgrade from Tanzu Observability by Wavefront Nozzle v3 to Tanzu Observability by Wavefront Nozzle v4.1.1. That version of the nozzle includes a checkbox that supports retaining Service Broker Bindings. The process is discussed in this section.
Downgrade from Nozzle 4.1.0 to Nozzle 3.0
This section explains how to downgrade. For clarity, the section uses explicit version numbers.
Step 1. Uninstall v4 of the Tanzu Observability by Wavefront Nozzle.
|
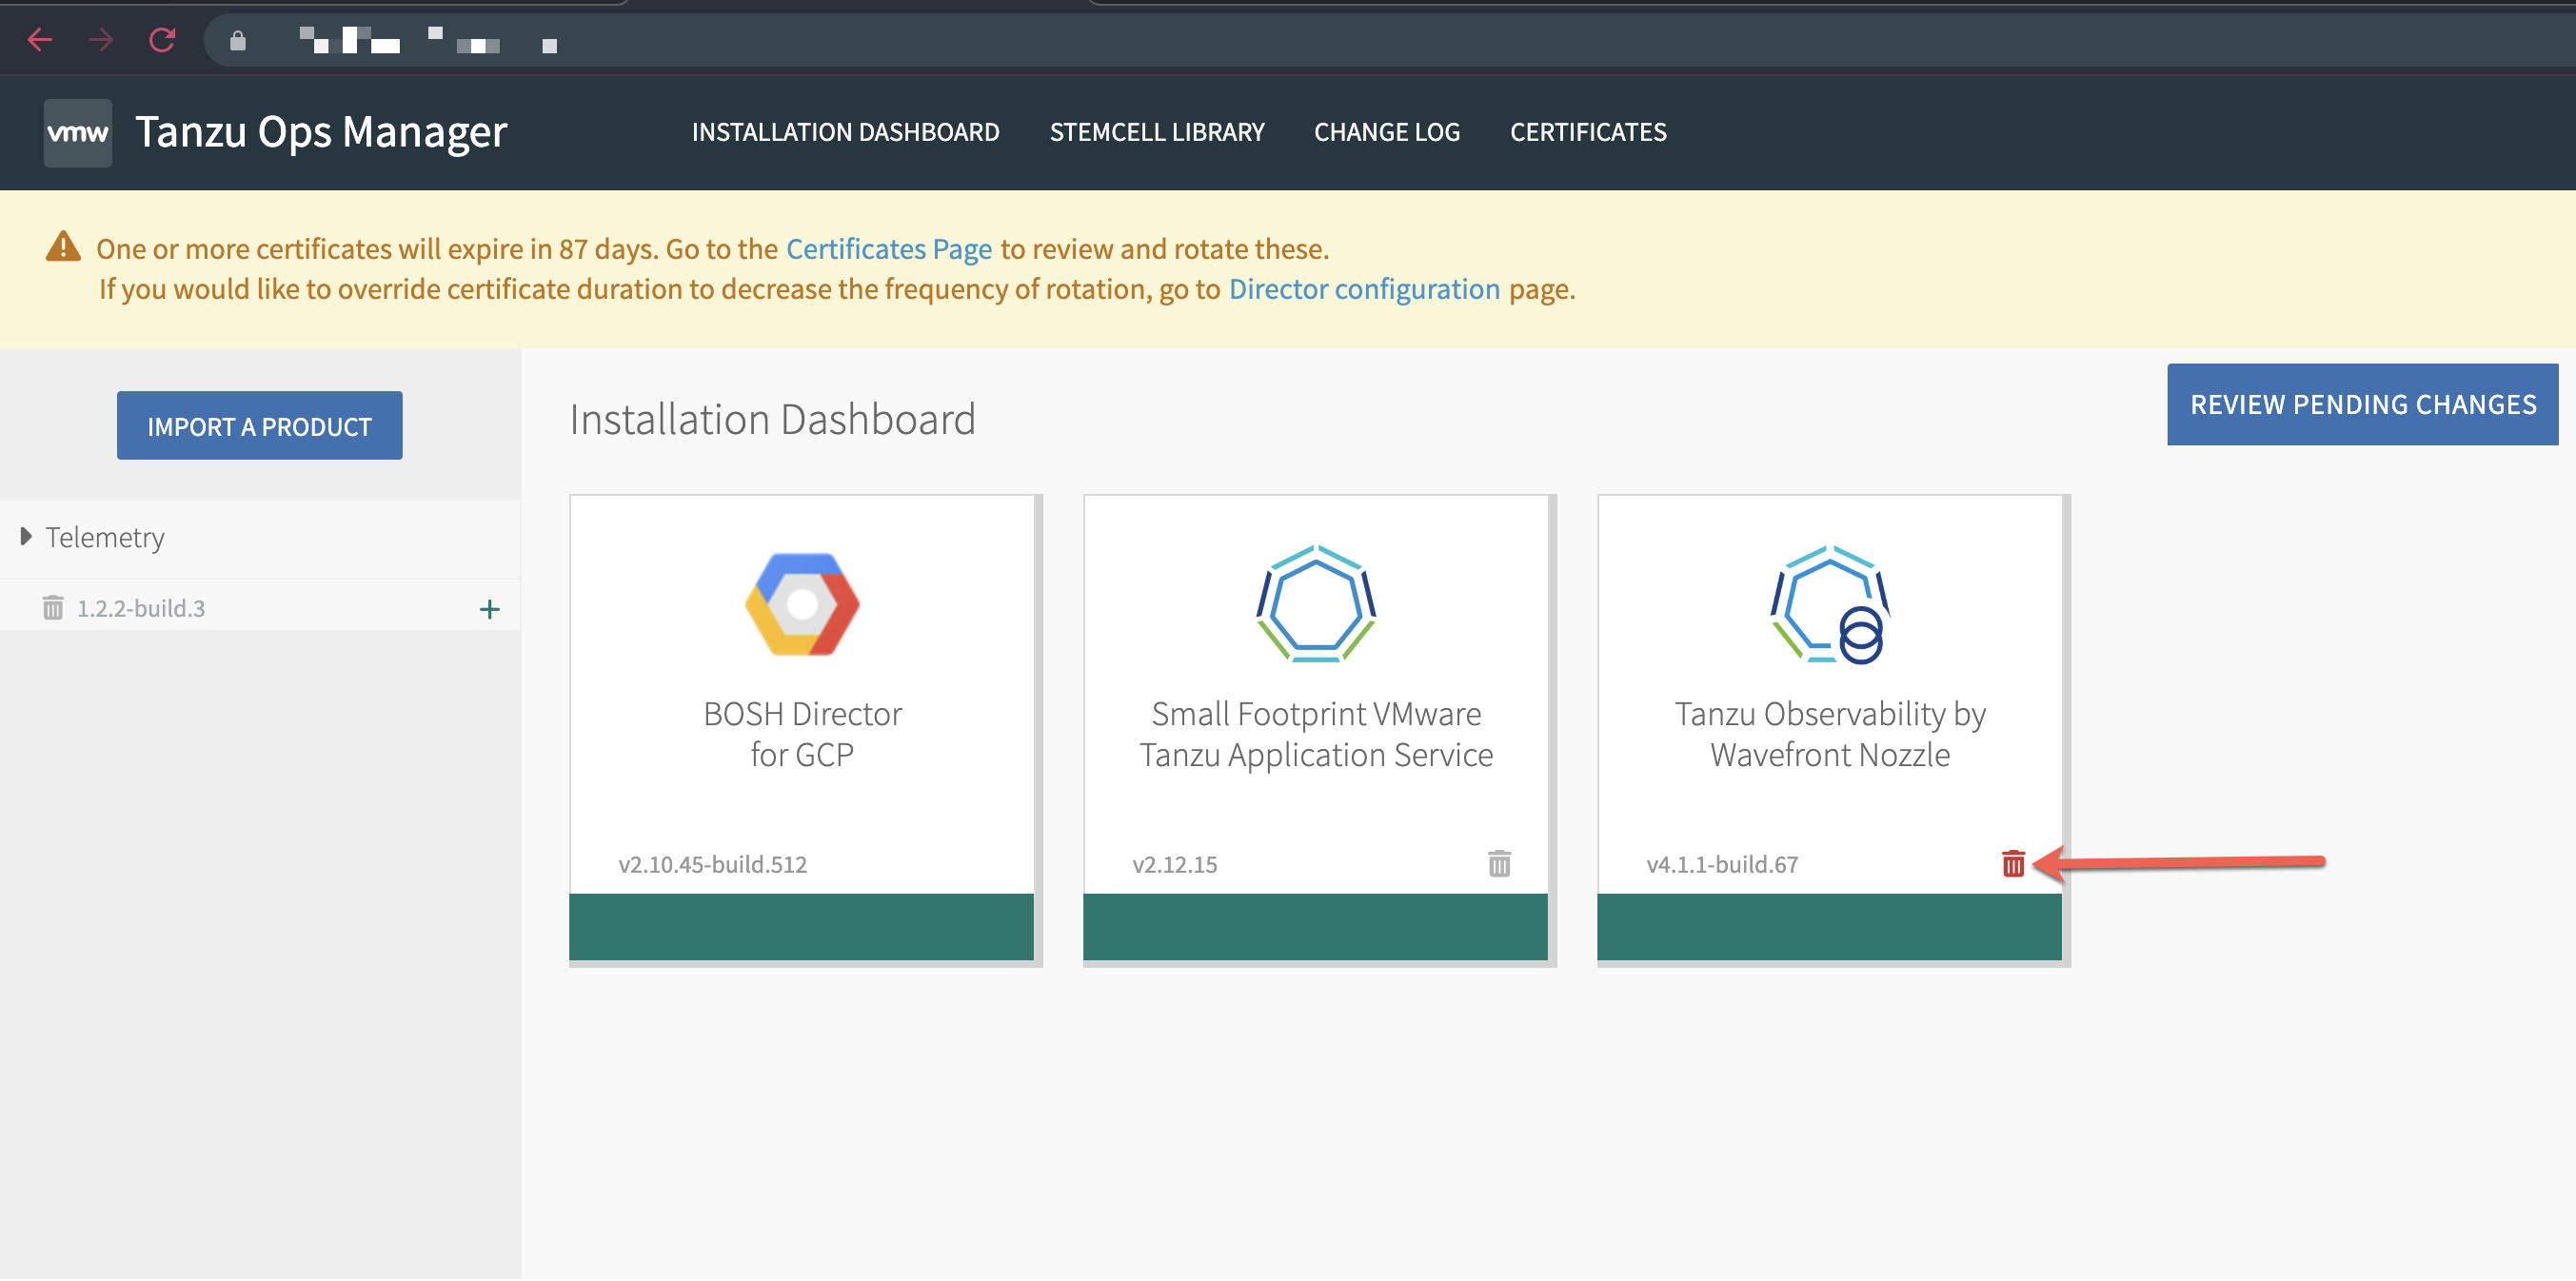 |
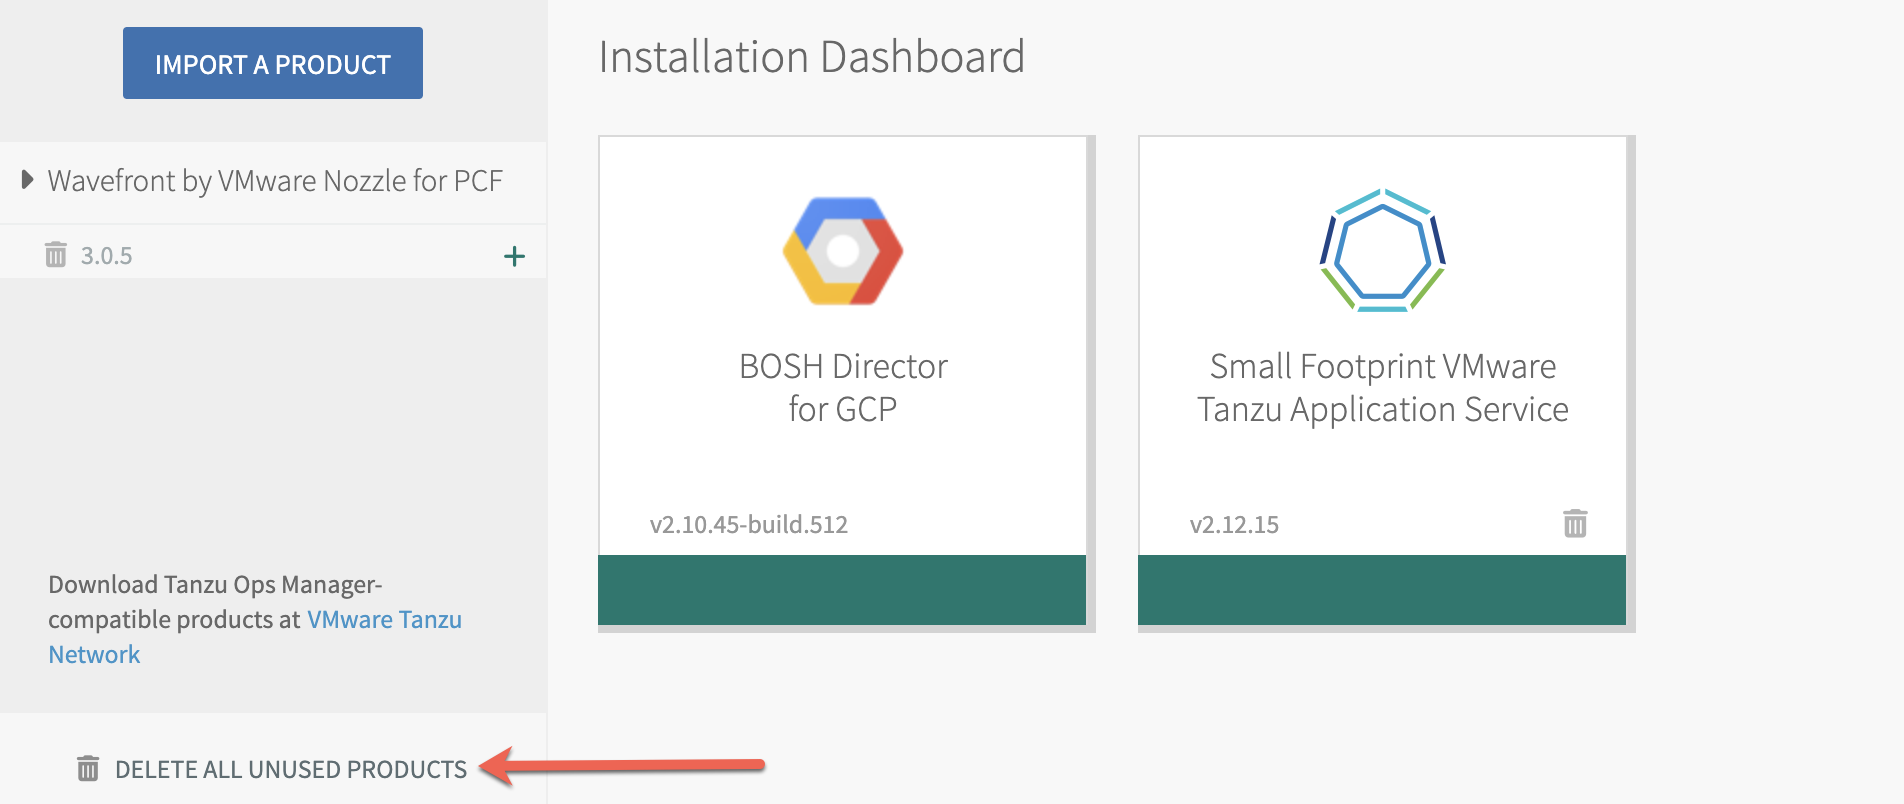
| Step 2. In the bottom left of the Ops Manager installation dashboard, click Delete all unused products and confirm. Note: If you don't delete all unused products, the import of the v3 nozzle might fail later with an error like the following: "Metadata already exists for name: wavefront-nozzle and version: 3.0.5".
|
 |
Step 3. Download v3 of the Tanzu Observability by Wavefront Nozzle.
Step 4. Import and install v3 of the nozzle.
|
|
Step 5. Configure and deploy the v3 nozzle:
|
 |
Install Nozzle 4.1.1 and Enable Service Broker Bindings
You enable service broker bindings as part of the Wavefront Proxy Config step of nozzle configuration.
To enable service broker bindings:
|
 |
Symptom: No Data Flowing In and Certificate Error
No data is flowing in from one or more of your foundations. When you check the proxy log, you see an error similar to:
2022-06-05T08:17:37Z E! [outputs.wavefront::wavefront-pipeline-2] wavefront flushing error: error reporting wavefront format data to Wavefront: "Post \https://wavefront-proxy.service.internal:4443/report?f=wavefront\: x509: certificate signed by unknown authority"
Cause
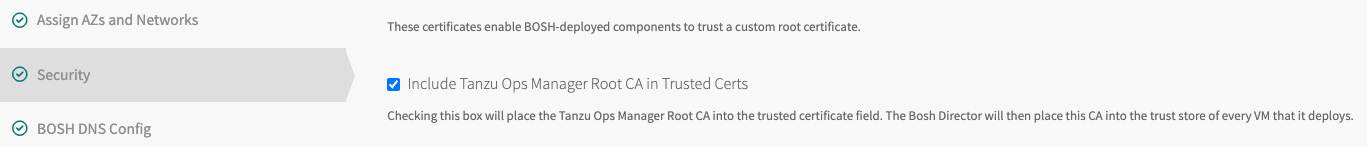
This error results if the TLS connection between the Telegraf VM and the Proxy VM fails because the Tanzu Ops Manager root CA was not included during setup.
Solution
Include the root CA by clicking the check box. The following screenshot shows a BOSH Director for GCP setup with Include Tanzu Ops Manager Root CA in Trusted Certs checked.
Symptom: No Data Flowing or Dashboards Show No Data
You have successfully set up the nozzle and the integration. However, you don’t see any data on the out-of-the-box dashboards. The most common cause is a problem with sending data to Tanzu Observability.
Potential Solutions:
- Ensure that the installation of the Wavefront Nozzle in has completed.
- Verify that the proxy uses the correct authentication credentials and Operations for Applications instance URL. You specify that information in Ops Manager in the Proxy Config page.
- In your Tanzu Application Service environment, verify that the BOSH jobs for Wavefront proxy and for the Telegraf agent are running.
-
In the BOSH CLI, use the
bosh depscommand to identify your wavefront-nozzle deployment, then tail the logs usingbosh ssh.% bosh deps % bosh ssh -d wavefront-nozzle-d62c653f58184da09b1d telegraf_agent % sudo -i % bpm logs -fa telegraf_agent -
If you see errors in the output here, this may help pinpoint a specific issue in the environment. Otherwise, contact support.
-
If there are no errors in Telegraf, the next step is to check the logs for the wavefront_proxy:
% bosh ssh -d wavefront-nozzle-d62c653f58184da09b1d wavefront_proxy
% sudo -i
% bpm logs -fa wavefront_proxy
-
- Verify that data is flowing from the Wavefront proxy to your Wavefront instance. See Proxy Troubleshooting.
Symptom: Higher than Expected PPS Rate
The PPS (points-per-second) rate can affect performance and potentially the cost of using Tanzu Observability.
- 4.x: The PPS generated by the Tanzu Observability by Wavefront Nozzle version 4.x should be predictable and relatively consistent for any given foundation, because metrics are scraped at a fixed interval.
- 3.x: Version 3.x of the Nozzle follows a push-based model. PPS varies based on factors such as HTTP requests being served by the Gorouter, so PPS is less predictable.
However, it can be difficult to predict the average PPS of a TAS foundation ahead of time because several factors affect the total number of metrics that are generated:
- The TAS version.
- The size of the foundation.
- Other TAS components running on the foundation.
PPS might increase or decrease when individual TAS components are installed, upgraded or removed. Each individual component contributes its own metrics.
Solution:
- Increase the Telegraf agent scrape interval. Metrics will be collected less frequently, and average PPS decreases.
Future releases will allow more targeted approaches to reducing PPS, for example, by filtering out unwanted metrics.
Symptom: Incomplete Data in Tanzu Observability
Data from your TAS foundation are visible in Tanzu Observability dashboards and charts, but seem incomplete.
Potential Cause:
Incomplete data is most likely caused by one or more components failing to keep up with the volume of metrics that are generated by the TAS. Typically this happens when the gauge exporter emits large numbers of metrics, and the Telegraf agent is not able to ingest these metrics and to forward them to the Wavefront proxy before the next collection cycle begins. Errors might result and metrics are dropped as the Telegraf agent tries to catch up.
Investigation:
Here are some things you can do.
- Look for errors in bpm logs on the Telegraf agent or in the Wavefront proxy logs. See Proxy Troubleshooting and Telegraf Troubleshooting for details.
- Look for collection errors from Telegraf (
tas.observability.telegraf.internal_gather.errors). - Look for long collection times from Telegraf (
tas.observability.telegraf.internal_gather.gather_time_ns).
Potential Solutions:
In the Ops Manager tile:
- Increase the size of the Telegraf Agent Virtual Machine.
- Increase the Telegraf scrape interval.
Symptom: Unexpected App in the Healthwatch Space
When you upgrade from version 4.x to 4.2.0, a cleanup job can sometimes fail and leave an unused app and route.
To check for this situation, log in to your cf environment, and try these commands:
cf target -o system -s healthwatch2
cf apps
cf routes
If you see an app called tas2to-sli-test-app in the results of cf apps or a route matching that name in the cf routes results, you should clean them up.
- To delete the app, run the command:
cf delete tas2to-sli-test-app -
To delete the route, run the command:
cf delete-route example.com --hostname tas2to-sli-test-app
Symptom: The Percentage in the Application CPU % Chart Is Over 100%
The Application CPU % chart in the TAS: Workload Monitoring dashboard lists the application instances ranked by the highest utilization of their CPU entitlement. Sometimes, the Application CPU % chart might show high CPU usage percentage - more than 100%, for some of the applications. This happens when an application container is using more than its share of CPU, and the Diego Cell hosting the application has spare capacity.
Although CPU usage over 100% might seem unexpected or alarming, it can also occur normally as a result of intentional planning.
If the host has spare CPU, it does not throttle the CPU usage of applications. But, if the host has more demand on its CPU, it tries to throttle all the containers fairly, based on their entitlement. If an application is throttled, you can observe degraded performance from that application. If the application is functioning normally with occasional CPU spikes, you can choose to leave the memory and CPU entitlement unchanged.
Because throttling only happens on Diego Cells that are heavily utilized, the CPU utilization of the Diego Cells themselves is more important to monitor than the container CPU utilization. Application-level performance metrics, such as RED metrics, are also often more important than container CPU.
If an application container is consistently using more than its CPU entitlement, the solution is to scale up the memory requested by the app, which also increases the container’s CPU share. See App manifest attribute reference.
Note that increasing the app memory might mean that Diego must move the application to a Cell with more available CPU and memory entitlement. If Diego is unable to find a Cell to run the larger application container, the solution is to scale up the Diego Cells, either horizontally or vertically. Adding Diego Cells or increasing the size of your Diego Cells will increase your infrastructure costs.
Considering your own infrastructure costs and performance goals, you may want to keep the memory and CPU entitlements for certain apps at their typical CPU utilization, rather than at their peak utilization. If you provision all your apps with memory and CPU for their peak needs, you will need more Diego capacity to schedule those apps, and much of this capacity will be unused most of the time. If you provision most apps for their typical utilization, you will see spikes above their entitlement, but you will be using your infrastructure more efficiently and will see lower infrastructure costs. The optimal choice is to provision some apps for peak utilization and others for typical utilization, based on business priority or performance sensitivity.
Symptom: The Percentage in the CPU Usage Chart Is Over 100%
The CPU Usage chart in the TAS: BOSH Director Health dashboard might show CPU usage higher than 100%. This is because when using multi-core processors in CPU instrumentation, the usage maximum is the number of cores multiplied by 100.
Because modern computers have multiple cores, where previously they were predominantly single-core processors, CPU instrumentation can show CPU utilization greater than 100%.
If you observe high value of system_cpu_core_sys reported for the BOSH Director for the displayed time interval, you can investigate the cause of the spike. If the cause is a normal workload increase, then simply increase the CPU allocation for the BOSH Director.