Summary
rate([<timeWindow>,] <tsExpression>)
Returns the per-second rate of change for each time series described by the expression. The results include only positive rates of change. Use deriv() if you want negative rates of change as well. Consider ratediff() if the time series have lots of gaps or irregular reporting intervals.
Parameters
| Parameter | Description |
|---|---|
| timeWindow | Length of the reporting interval for the time series. You can specify a time measurement based on the clock or calendar (1s, 1m, 1h, 1d, 1w). Default is minutes if the unit is not specified. |
| tsExpression | Expression that describes the time series to return rates of change for. |
Description
The rate() standard time function returns the rate of change (per second) between adjacent increasing data values in the time series described by the expression.
For example, consider a metric that counts the cumulative total number of logins for an application over time. You can use the rate() function to see how fast the logins are being added, reported as a number of logins per second.
rate() returns a separate series of results for each time series described by the expression.
rate() returns only positive changes in value. As a result, it’s primarily useful for counter metrics, which are metrics that report cumulative totals (increasing values) over time. You can use deriv() if you want to see rates of change in other kinds of metrics.
Rate of Change
rate() finds the per-second rate of change between pairs of adjacent (successively reported) data values, where the later value is greater than the earlier value.
The rate of change between a pair of increasing data values is computed as follows:
1. Subtract the earlier data value from the later value.
2. Divide the difference by the number of seconds in the reporting interval.
For example, let’s say that a metric has a reporting interval of 30 seconds, and reports successive data values:
| Value | Time |
| 105,500 | 05:45:00pm |
| 105,750 | 05:45:30pm |
The rate() function computes the rate of change between these data values using the following formula: (105,750 - 105,500)/30. The resulting value (8.333) is returned at 05:45:30pm, indicating that the metric increased by 8.333 per second between the two values.
Notice that the per-second rate of change between the same two data values would be quite different if the metric had reported them two minutes (120 seconds) apart: (105,750 - 105,500)/120. In this case, the returned per-second rate would be 2.083.
Response to Counter Resets
A counter metric normally produces an monotonically increasing series of data values, for which rate() returns positive rates of change. However, a metric might reset its counter on occasion – for example, if the metric’s source restarts or encounters a particular condition.
A metric indicates a counter reset by reporting a lower data value immediately after a higher data value. By default, rate() responds to a counter reset by simply producing a gap in its results at that point, rather than reporting a negative rate of change. (You can optionally request that rate() fill in the gap with an estimated initial rate.)
If the metric’s counter restarts, the metric reports a higher data value after the lower reset value, and rate() resumes its results by computing a positive rate of change.
Estimated Initial Rates
By default, rate() produces gaps in its results corresponding to:
- The first data value to be reported by a new time series. (
rate()needs a preceding value for its calculation, but the first value has no predecessor.) - The first of data value in a sequence of increasing values reported after a counter reset. (
rate()does not report negative rates of change.)
You can enable rate() to return estimated rates of change in place of such gaps. To do this, you include the reporting interval of the time series as an explicit parameter. For example, if my.metric reports data values once a minute, you could specify rate(1m, ts(my.metric)). This tells rate() to implicitly insert an inferred value of 0 at the specified interval before each first-reported data value in a new or restarted time series. rate() can then use the number of seconds in the specified interval to calculate the per-second rate of change from the inferred 0 value to the actual data value.
Examples
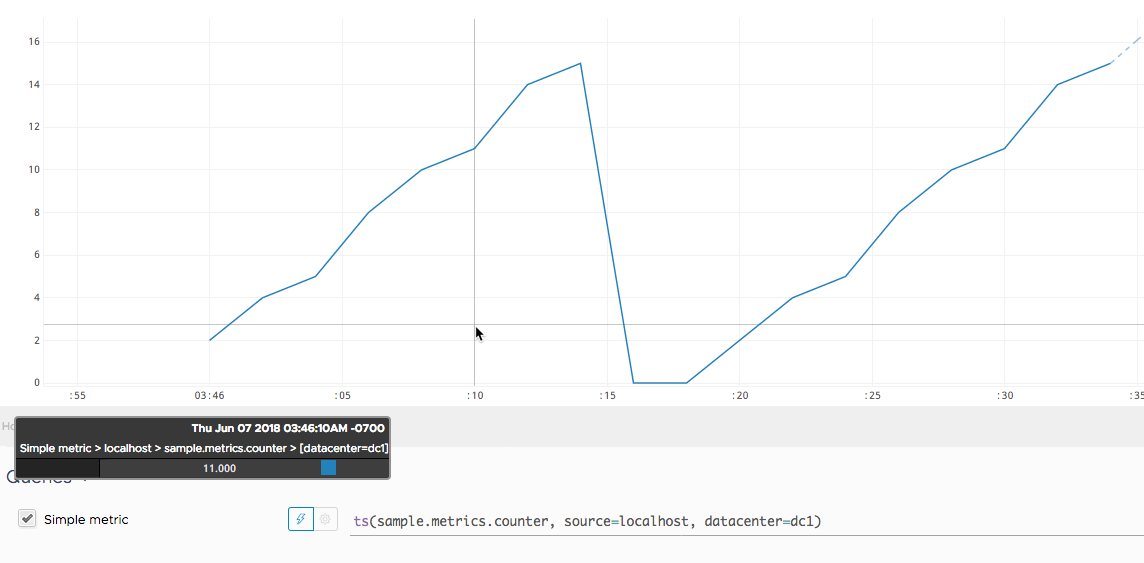
Here’s a query that shows a sample metric that increments a counter. The reporting interval is 2 seconds, which means the counter increments every 2 seconds. We see the count climb from 3:46:00 to 3:46:16, when it resets to 0. The counter restarts at 3:46:20.
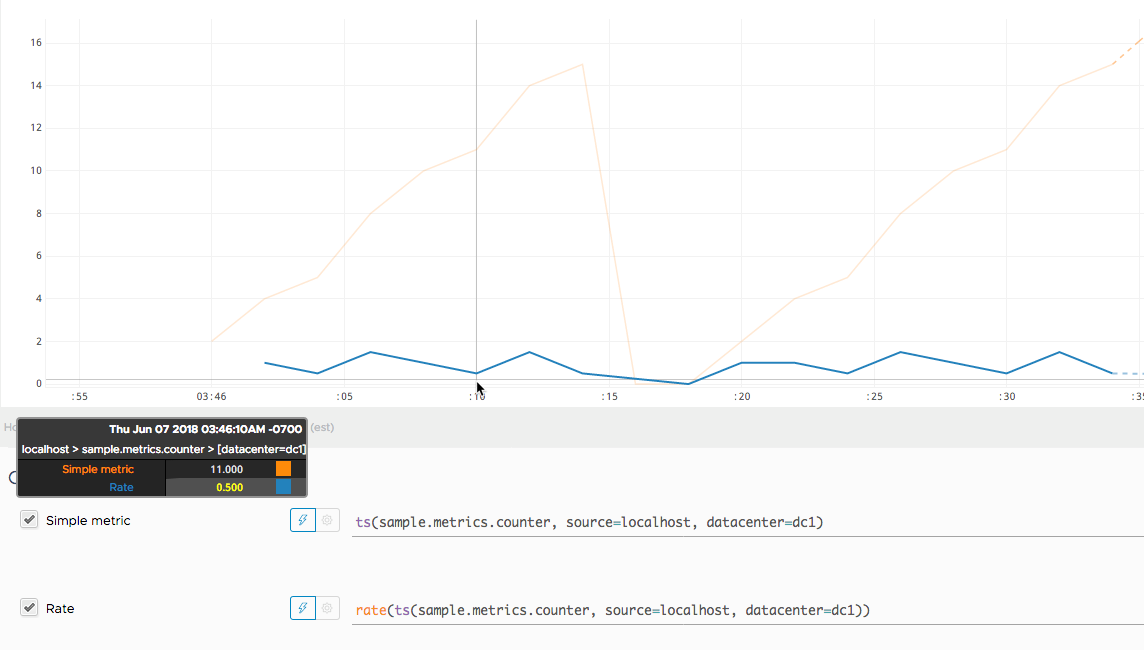
Now we apply rate() to our original query to find out how fast the counter grows per second. Notice:
rate()starts reporting at the counter’s second value.- At 3:46:10, the rate of growth is .500, indicating the total has grown half a unit per second since the preceding value.
- No rate is reported when the counter falls to 0. The reported rate is 0 while the counter stays at 0, and then becomes positive when the count starts to climb.
See Also
-
The discussion of counters explains how to use
rate()andratediff()for counters