This page provides an overview of what you can do with the VMware Tanzu™ Kubernetes Grid™ Integrated Edition integration. The documentation pages only for a limited number of integrations contain the setup steps and instructions. If you do not see the setup steps here, navigate to the Operations for Applications GUI. The detailed instructions for setting up and configuring all integrations, including the VMware Tanzu™ Kubernetes Grid™ Integrated Edition integration are on the Setup tab of the integration.
- Log in to your Operations for Applications instance.
- Click Integrations on the toolbar, search for and click the VMware Tanzu™ Kubernetes Grid™ Integrated Edition tile.
- Click the Setup tab and you will see the most recent and up-to-date instructions.
VMware Tanzu™ Kubernetes Grid™ Integration
VMware Tanzu™ Kubernetes Grid™ Integrated Edition, previously called VMware PKS, enables operators to provision, operate, and manage enterprise-grade Kubernetes clusters. This integration uses the wavefront-kubernetes-collector, which runs natively in Kubernetes. The integration collects detailed metrics about the containers, namespaces, nodes, pods, deployments, services and the cluster itself. See VMware Tanzu Kubernetes Grid Integration Details for a list of predefined alerts, an architecture overview, and troubleshooting info.
This integration explains how to configure Tanzu Kubernetes Grid Integrated Edition monitoring with Operations for Applications from the PKS tile present in PCF Ops Manager. After you’ve completed the integration setup, you can use Operations for Applications to monitor the Tanzu Kubernetes Grid Integrated Edition cluster.
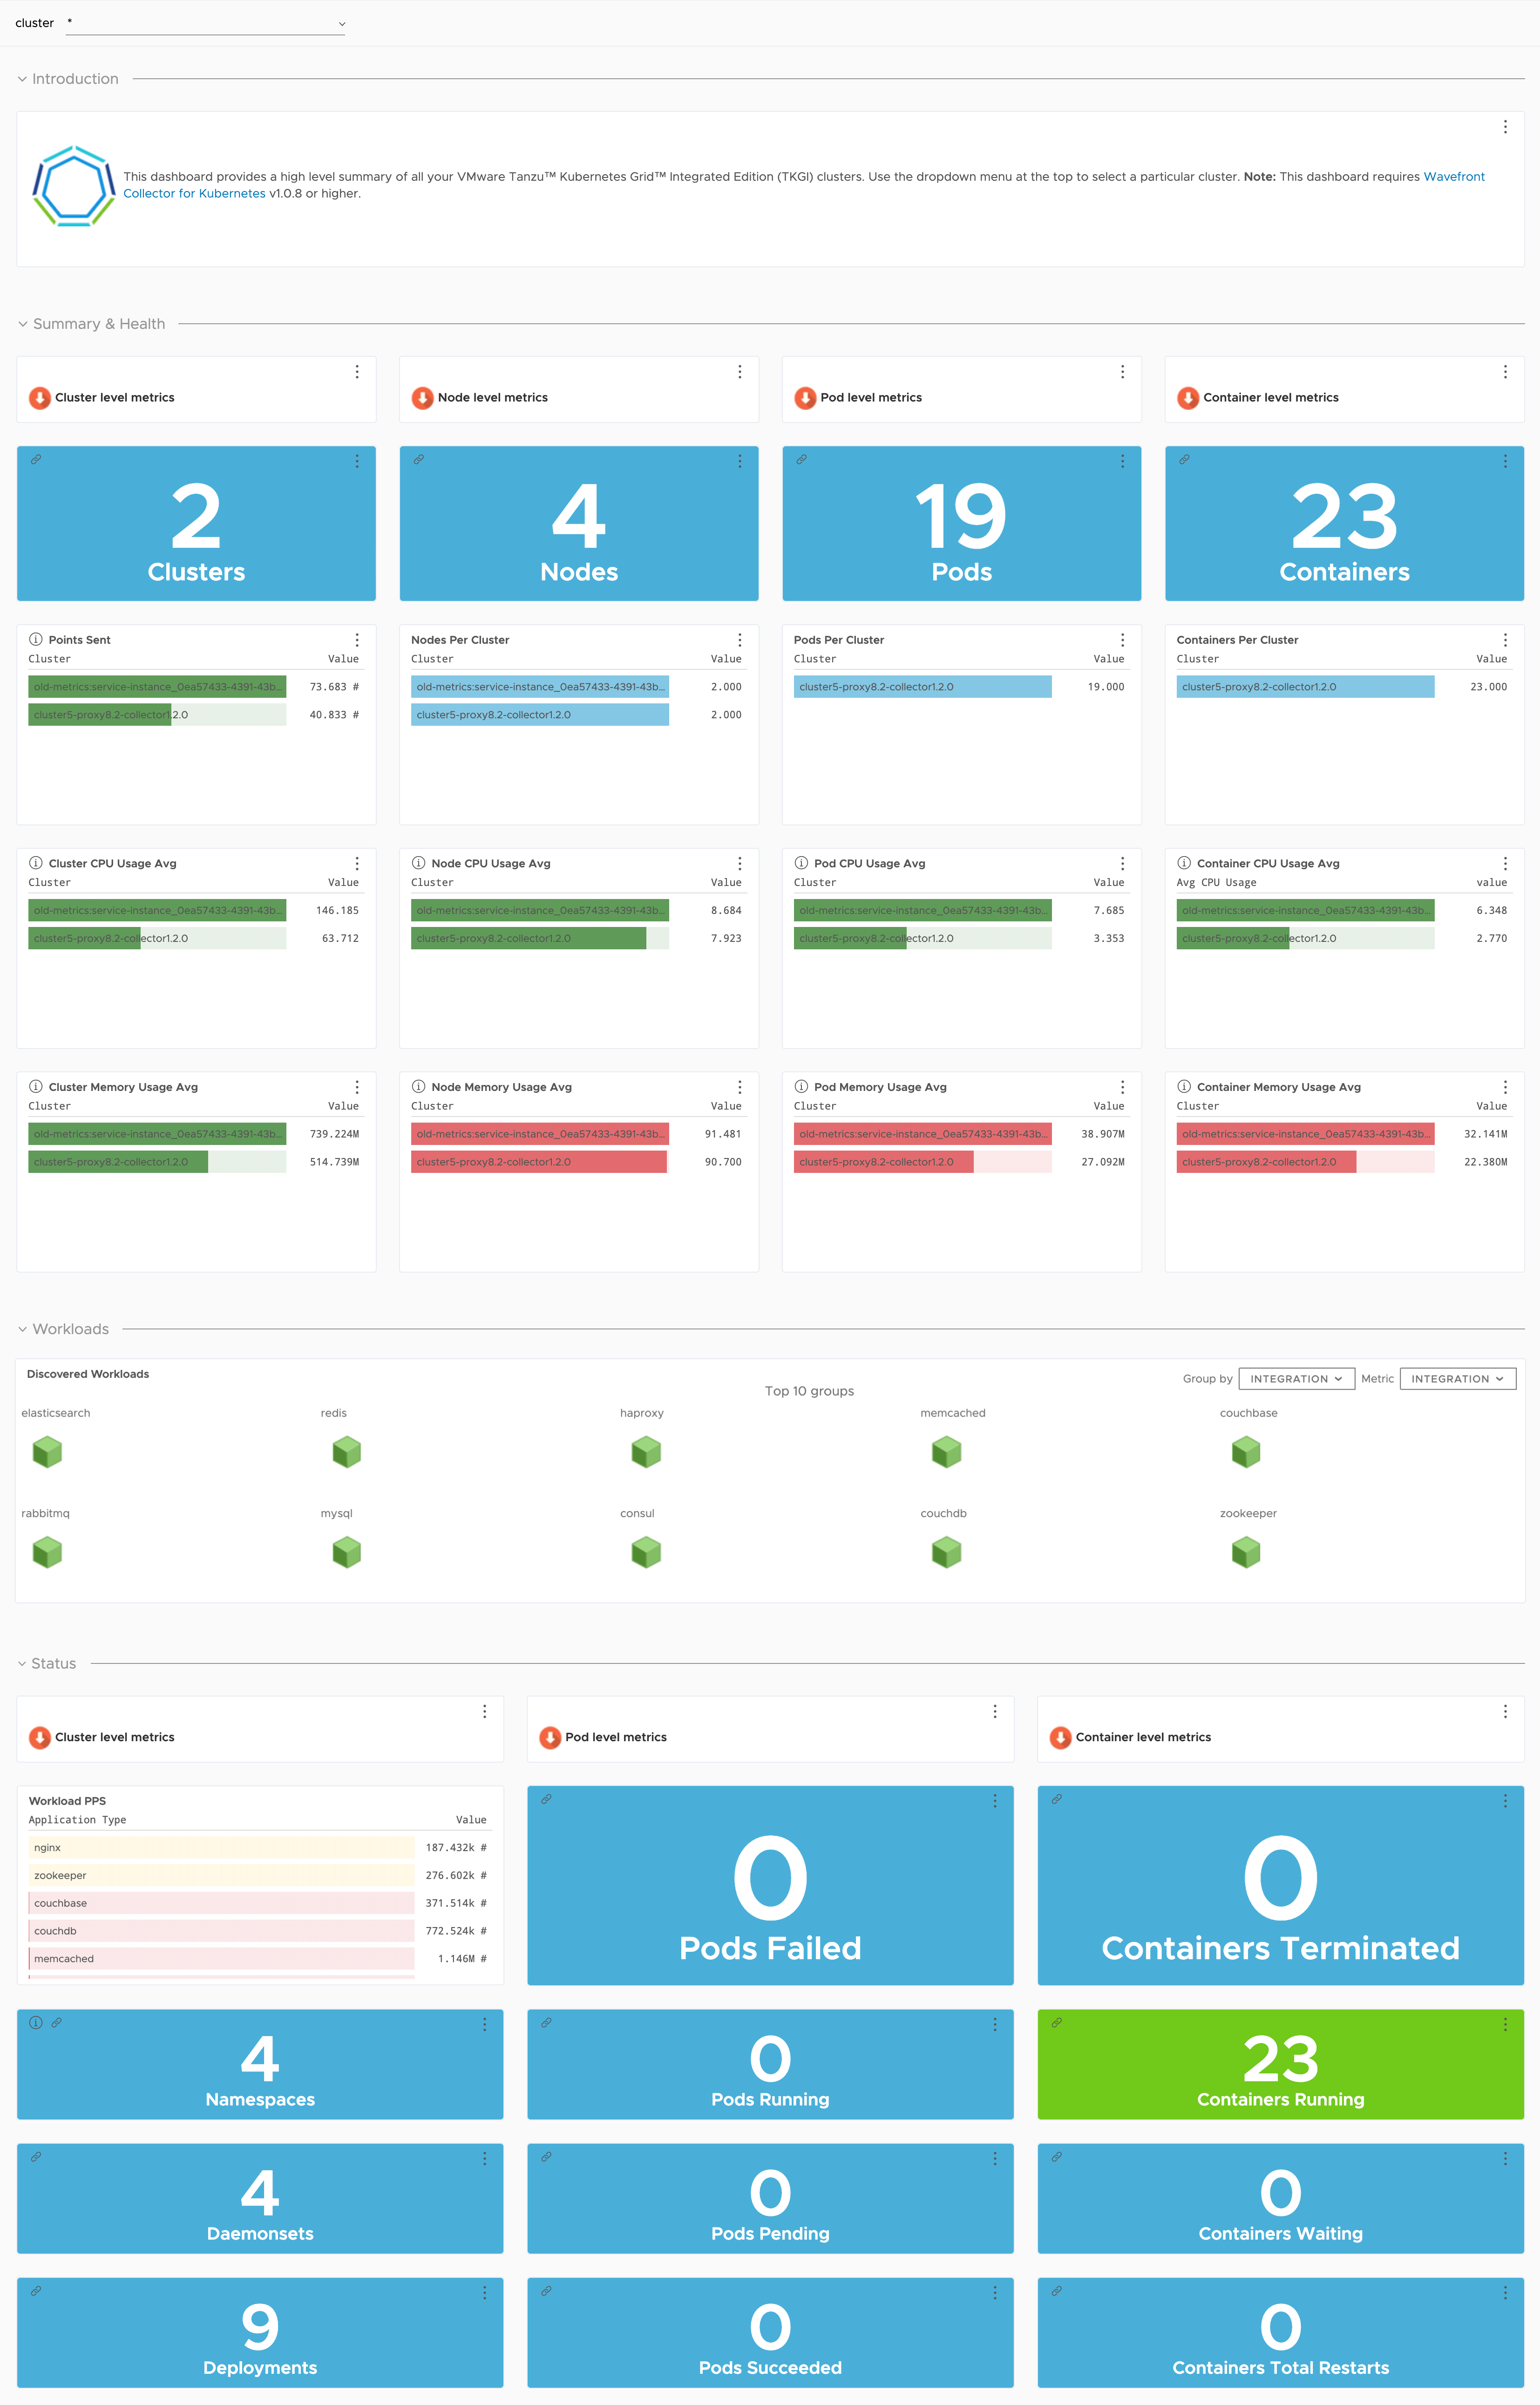
In addition to setting up the metrics flow, this integration also installs a dashboard. Here’s a preview of the Summary dashboard.
Alerts
- Node memory usage high:Alert for high usage of node memory
- Node memory usage too high:Alert for very high usage of node memory
- Node CPU usage high:Alert for high usage of node CPU
- Node CPU usage too high:Alert for very high usage of node CPU
- Node storage usage high:Alert for high usage of node storage
- Node storage usage too high:Alert for very high usage of node storage
- Too many containers not running:Alert for very high number of containers not running
- Node unhealthy:Alert for unhealthy node