These release notes give an overview of the changes for the 2023-07.x to 2023-13.x releases of the VMware Aria Operations for Applications (previously known as Tanzu Observability by Wavefront) service.
2023-13.x Release Notes
-
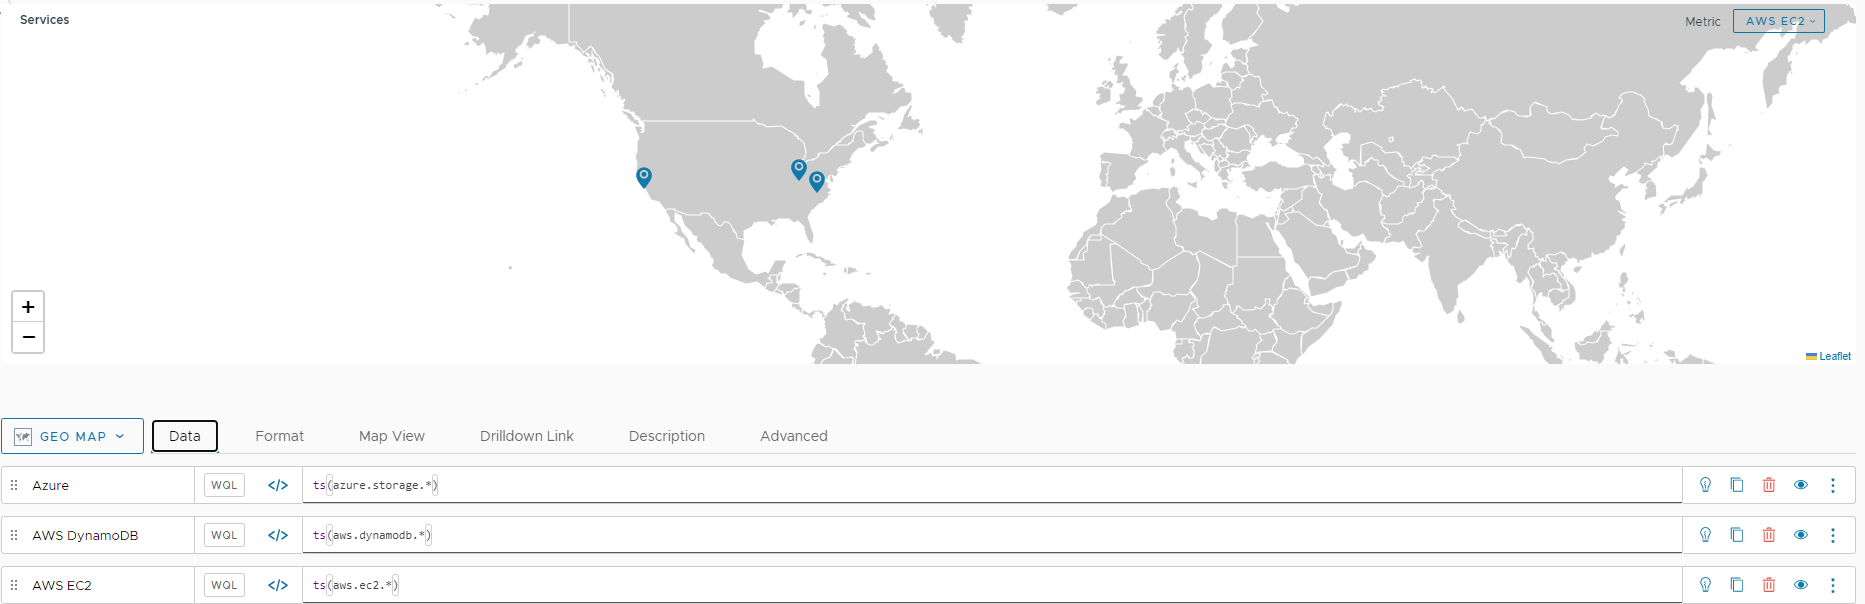
Geo Map Chart: With this release, we have included a new type of chart which allows you to visualize your ingested data by location. For more information, see Geo Map Chart.
-
Proxy Configurations in the UI: From the Proxies Browser, you can now view the current configuration properties of Wavefront proxies 12.2 and later. For more information, see Examine the Proxy Configuration Properties.
-
No Data Alerts and Maintenance Windows: Maintenance windows that are refined by point tags, sources, or source tags no longer apply to alerts in NO DATA state.
2023-11.x Release Notes
-
Usage Summary Dashboard Improvements: Added support for customers with burndown commit contracts.
The charts for customers with burndown commitments slightly differ from the charts for customers with billable commitments.
For more details, see Examine Your Overall Usage.
-
Ingestion Policies Improvements:
-
New Ingestion Policies permission.
Users with that permission can create, edit, and delete ingestion policies.
-
Changed navigation to the Ingestion Policies page.
Ingestion Policies is now a separate menu item under the gear icon on the toolbar.
-
New Revert functionality on the Earlier Versions page.
Users with the Ingestion Policies permission can revert an ingestion policy to an earlier version.
For more details, see Monitor Usage with Ingestion Policies.
-
-
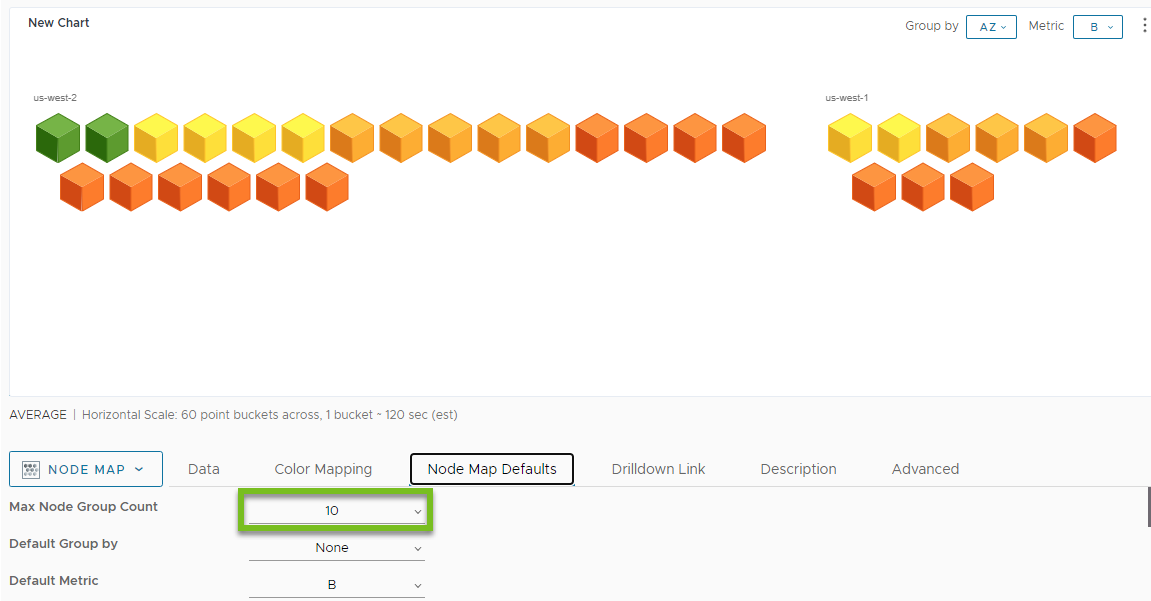
Node Map Chart Improvements: You can specify the maximum number of node groups to display on a node map chart. When you open a node map chart in edit mode or create a new node map chart, on the Node Map Details tab, from the Max Node Group Count drop-down menu you can select the maximum number of groups to display on the chart. The default value is 10, the maximum value is 35. For details, see Node Map Chart.
2023-10.x Release Notes
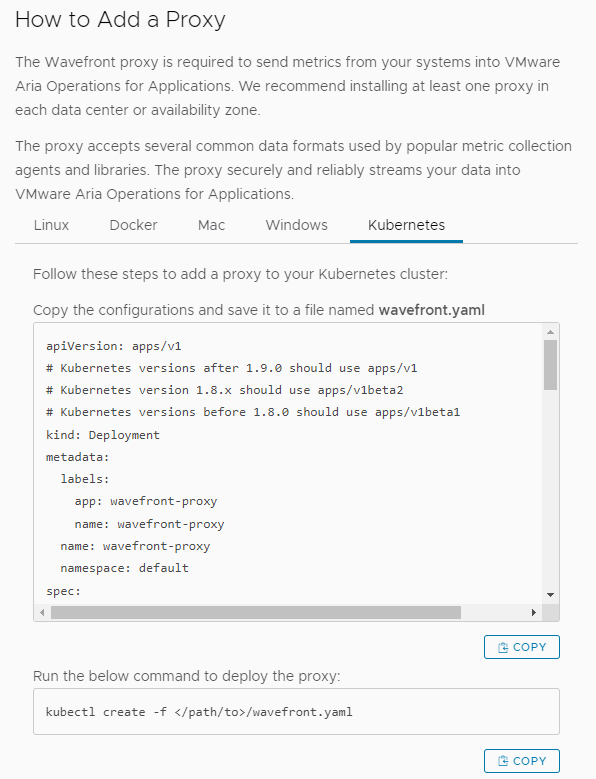
Proxy Setup Instructions for Kubernetes in the UI: When you install a proxy from the UI, you can now click the Kubernetes tab to copy the proxy configurations and the deployment command.
2023-09.x Release Notes
Analyze Your Queries: With this release you can use the Query Analyzer and analyze your queries and their subqueries. When you expect to see certain data in Operations for Applications, but it doesn’t show up for some reason, charts display a No Data message. When you see this message on a chart, use the Query Analyzer to analyze and troubleshoot your queries and subqueries.
2023-08.x Release Notes
Alert Targets Browser Page Improvements: The Alert Targets browser page is now improved and allows you to:
- Hide and show details for all alert targets or for a specific alert target.
- Sort alert targets either by the last updated date or by target name.
- Hide and show the filters listed on the left.
For more details, see View Alert Targets.
2023-07.x Release Notes
-
Proxies Browser Revamp:
Streamlined experience that improves monitoring and managing your proxies.
- Configurable proxies list in table format lets you explore your proxies in detail.
- Individual proxy dashboards to examine the health and usage of each proxy.
-
Amazon Web Services Integration Improvements:
With this release, we have improved the AWS CloudWatch integration. When you configure the AWS CloudWatch integration, you can add custom namespaces to monitor more services, even those that are not in the default Products list of the AWS services in our GUI. For more information, see the integrations release notes.
-
Ingestion Policies Improvement:
When you assign a key-value pair to an ingestion policy with the point tags scope, you can now set a wildcard for the tag value. For example, you can assign
env="*". -
Monitor the Status of Your Service:
You can use the public VMware Cloud Services Status Page to monitor your service for incidents and maintenance. - For confidentiality reasons, we show the service status of each customer cluster by using a cluster alias name. Find Your Cluster Alias Name.
- Outages and other service-wide events are reported on the VMware Cloud Services status page. View the Status of Your Service.
- You can subscribe to notifications for incidents and scheduled maintenance of your service. Subscribe for Status Updates.