These release notes give an overview of the changes for Release 2020.26 of the VMware Aria Operations for Applications (previously known as Tanzu Observability by Wavefront) service.
PromQL Support (Beta)
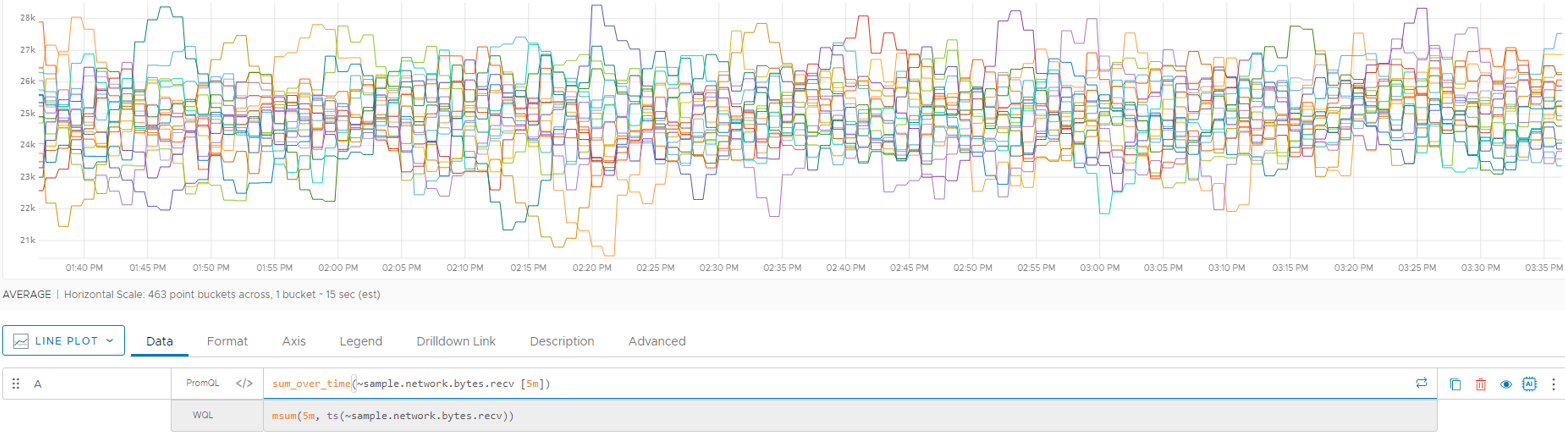
You can now use PromQL queries on the Wavefront query line. See Using PromQL in Wavefront to get started.
Delta Counters and cs() Function
Delta counters are now first class objects. Delta counters allow to aggregate counter values across multiple sources. The aggregation happens on the Wavefront service, not locally. Most importantly, delta counters are massively scalable. The Wavefront service can aggregate millions of delta counter values.
- Any metrics that start with a delta character continue to be treated as delta counters. Delta counters bin to a minute timestamp and treat write operations to the same bin as deltas
- A new top-level function,
cs, supports intuitive manipulation of delta counters. You can use thecsfunction with filters, function, etc. just like thets()function. - Many existing sample applications, especially tracing examples, have been revised to use delta counters and
cs().
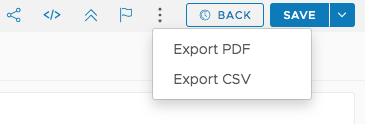
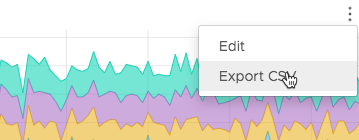
Export CSV Option
You can now export any chart to CSV, even if the chart is not in Edit mode:
|
 |
|
 |
Proxy 9.x
See the Wavefront proxy 9.0 release notes for details.
- New proxy configuration settings to support:
- Protobuf format via gRPC for the Jaeger integration.
- Application and service name configurations so that RED metrics are reported with these tags.
- (Beta) Intelligent traffic shaping to manage bursty traffic patterns.
- (Beta) AWS Simple Queue Service (SQS) as storage mechanism for queued data.
- (Beta) User-friendly conditions for preprocessor rules.
Miscellaneous Improvements
Dashboard Preferences for Controlling Event Overlays
Events can make your charts look cluttered. You can control how you see events on the charts using the charts settings or the dashboard setting. See Control Event Overlays for details.
Save and Customize Charts in the Service dashboard
Customers using Distributed Tracing have asked to create dashboards from Wavefront Service dashboard charts. You can now view queries used in Service dashboard charts and save these charts to your own dashboard. See Save Charts in the Service Dashboard for details.
Service Accounts Permissions
Service accounts now require Metrics permissions to run queries.
No Obsolete Metrics for Derived Metrics
Starting with this release, metrics that are not reported for a certain period of time (obsolete metrics) are removed from derived metrics.
Additions to ~query.*.scanned Internal Metrics
New internal metrics allow you to monitor histograms and spans. The result is the following:
| ~query.summaries_scanned | Per-second rate at which metrics are being queried from dashboards, alerts, charts or API calls. |
| ~query.spans_scanned | Per-second rate at which spans are being queried from dashboards, alerts, charts or API calls. |
| ~query.histograms_scanned | Per-second rate at which histograms are being queried from dashboards, alerts, charts or API calls. |
Documentation Changes
- In response to user feedback, we’ve decided to single source the proxy release notes. They are now available exclusively on the Wavefront proxy GitHub page. It’s clear on that page which version is GA and which version is pre-release.
- Miscellaneous improvements in the Data > Metrics, Sources, and Tags section. Now including more details on Metrics Browser and Sources Browser.