Summary
timestamp(<tsExpression>)
Returns the timestamps for the reported data values in the time series described by the expression.
Parameters
| Parameter | Description |
|---|---|
| tsExpression | Expression that describes the time series to return timestamps for. |
Description
The timestamp() standard time function returns timestamps for the reported data values in the time series described by the expression. This function returns timestamps only for data values that are actually reported by a time series, and does not interpolate data values.
A timestamp is represented as a whole number of epoch seconds, which is the number of seconds that have elapsed since 00:00:00 Coordinated Universal Time (UTC) on January 1, 1970.
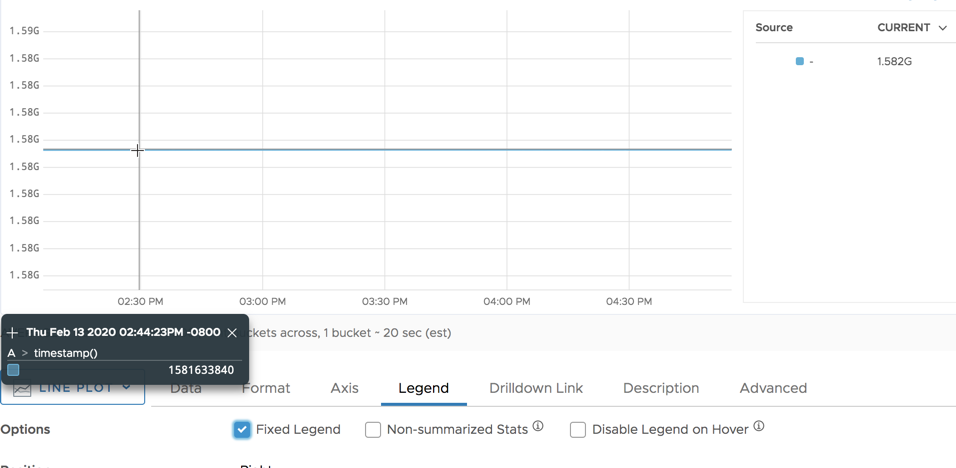
By default, the chart legend displays an abbreviated version of the epoch seconds that represent the timestamp. You can cause the legend to display the entire raw value of the timestamp in epoch seconds by holding down the shift key when you hover over the time series.
Note that if the chart’s bucket size is greater than 1 second, some of the displayed values will be averages over multiple timestamp values, and therefore shown as decimal numbers with fractional parts. To get precise timestamps, you can zoom in to shrink the chart’s bucket size to ~1 second.
Examples
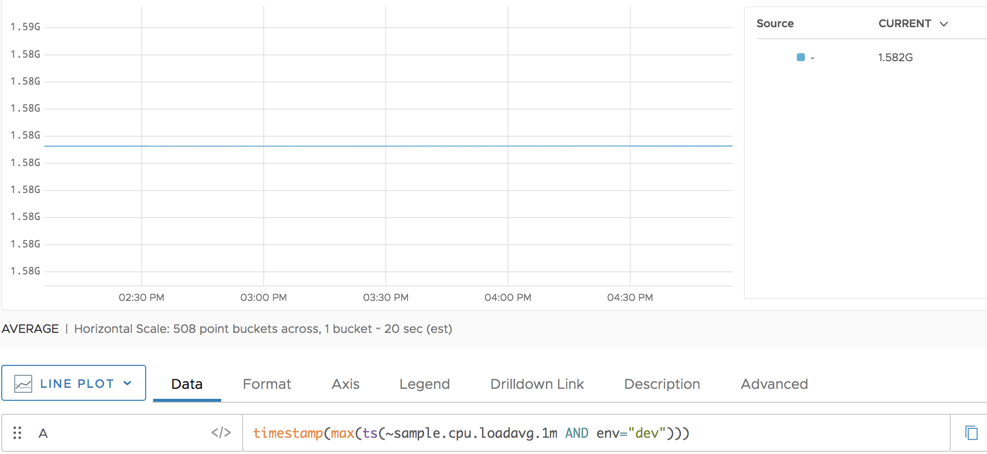
This chart shows the timestamp values associated with the reported maximum CPU usage percentage. Notice that the legend displays a timestamp as an abbreviated numeric value (1.582G).
To have the hover legend display as the actual number of epoch seconds, we can hold the Shift key. The fixed legend still shows 1.582G but the hover legend shows the actual number of seconds.