Summary
rawpercentile(<percentage>, <tsExpression>[, metrics|sources|sourceTags|pointTags|<pointTagKey>])
Returns the estimated raw percentage percentile across the set of time series described by the expression.
The results are computed from real reported data values only.
Use percentile() to include interpolated values.
Parameters
| Parameter | Description |
|---|---|
| percentage | A number greater than 0 and less than or equal to 100 that specifies the percentile of interest. You can include as many decimal points as you like. |
| tsExpression | Expression describing the set of time series to estimate the specified percentile for. |
| metrics|sources|sourceTags|pointTags|<pointTagKey> | Optional group by parameter for organizing the time series into subgroups and then estimating the specified percentile for each subgroup.
Use one or more parameters to group by metric names, source names, source tag names, point tag names, values for a particular point tag key, or any combination of these items. Specify point tag keys by name. |
Description
The rawpercentile() aggregation function lets you estimate the specified percentile for the data values at each moment in time, across the time series that are represented by the expression.
A percentile is a value below which a particular percentage of data values fall. You specify the percentage as a positive real number that is less than or equal to 100. For example, if you specify a percentage of 99.4, percentile() returns a value at the 99.4th percentile for each successive moment in time. You can specify a percentage of 50 to obtain the median value across the time series. See Computing an Estimated Percentile for more details.
By default, rawpercentile() returns a single series of percentile values by aggregating data values across all time series. You can optionally group the time series based on one or more characteristics, and obtain a separate series of raw percentile values for each group.
A raw percentile is computed only for those time series that actually report real values at a given moment in time.
No interpolation is performed to fill in data gaps in any time series.
Use percentile() if you want to include time series with interpolated values wherever possible. Using rawpercentile() instead of percentile() can significantly improve query performance.
Grouping
Like all aggregation functions, rawpercentile() returns a single series of results by default. You can include a group by parameter to obtain separate percentile results for groups of time series that share common metric names, source names, source tags, point tags, or values for a particular point tag key.
The function returns a separate series of results corresponding to each group.
You can specify multiple ‘group by’ parameters to group the time series based on multiple characteristics.
For example, rawpercentile(50, ts("cpu.cpu*"), metrics, Customer) first groups by metric names, and then groups by the values of the Customer point tag.
zone and ZONE, when you use an aggregation function and apply grouping, we consider zone and ZONE as separate tags. Computing an Estimated Percentile
A percentile is a value below which a particular percentage of data values fall. For example, in a given group of data values, the 75th percentile is a value that is greater than 75% of the data values in that group.
In general, percentiles can be estimated in various ways. The percentile() function computes the estimated raw percentile value for a given moment in time as follows:
- Obtain the set of data values, one from each time series that has an actual reported data value.
- Sort these data values into an ordered list.
- Use the specified
percentageto compute the estimated percentile position in the list, and then:- If the estimated percentile position is a whole number, return the data value at that position.
- If the estimated percentile position is fractional, find the two data values on either side of it, and use them to interpolate the value to return.
- If the estimated percentile position falls before the list’s first position (or after the list’s last position), return the smallest (or largest) data value in the list.
The formula for computing the estimated percentile position pos is pos = percentage * (n+1)/100, where n is the number of data values.
Examples
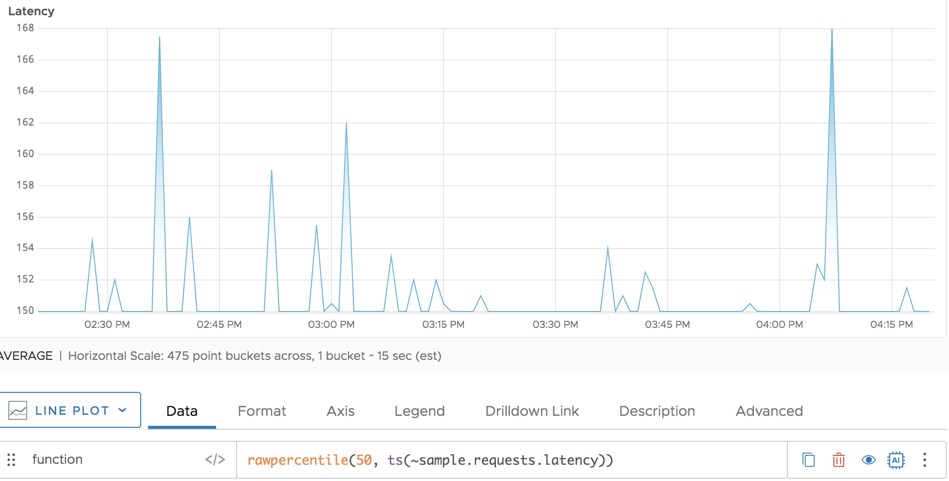
The following simple example shows the median (50th percentile) for the requests latency. It’s a single line because this example does not use a “group by” parameter.
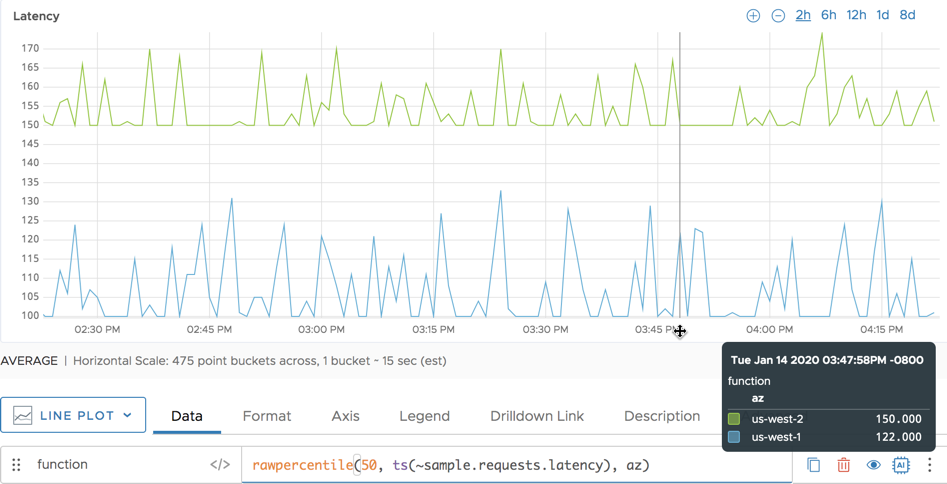
The following example shows the 75th percentile for the request latency. Here, we group by the env point tag and get a line for env=production and a line for env=dev.