Summary
mmin(<timeWindow>, <tsExpression>)
Returns the moving minimum of each time series over the specified time window.
Parameters
| Parameter | Description |
|---|---|
| timeWindow | Amount of time in the moving time window. You can specify a time measurement based on the clock or calendar (1s, 1m, 1h, 1d, 1w), the window length (1vw) of the chart, or the bucket size (1bw) of the chart. Default is minutes if the unit is not specified. |
| tsExpression | Expression that describes the time series you want moving minimums for. |
Description
The mmin() function returns the moving minimum of each time series over a shifting time window. For example, mmin(10m, ts(my.metric)) returns, at each point, the minimum data value over the previous 10 minutes for each specified time series.
By default, all the lines are dimmed. You can move the curser over a line to highlight it, and Cmd-select lines if you want to turn on highlighting for multiple lines to do comparisons.
Examples
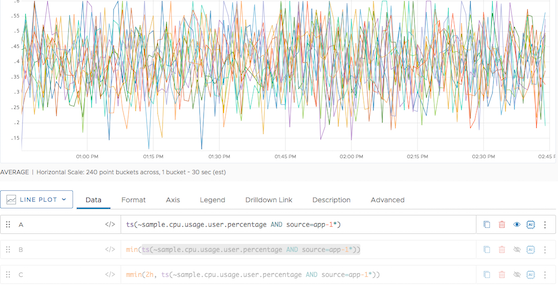
Let’s first look at a time series that shows results for all app-1* time series.
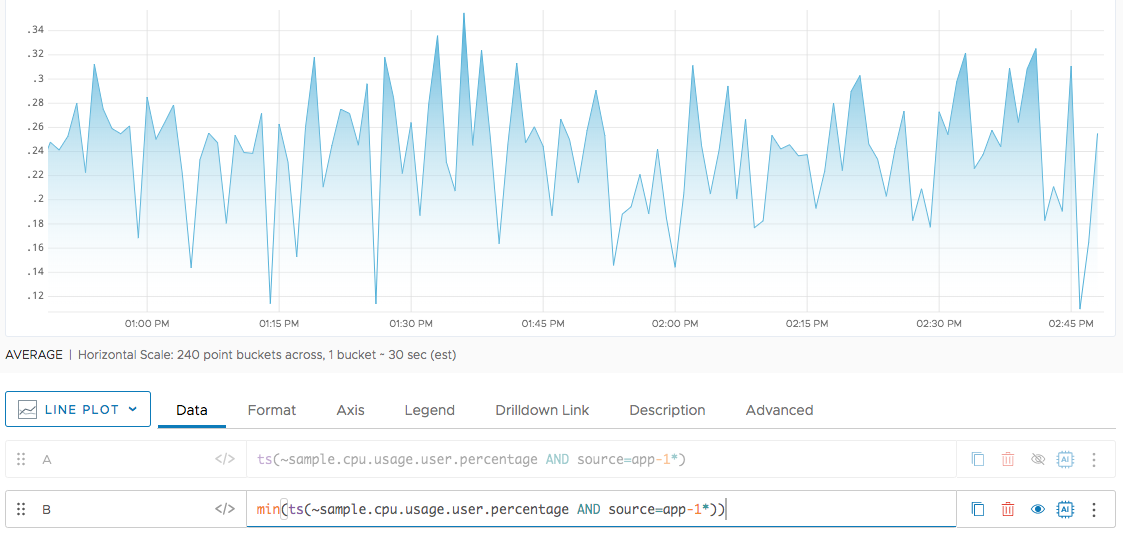
When we apply the min() function, we’re using aggregation and get the minimum for all time series.
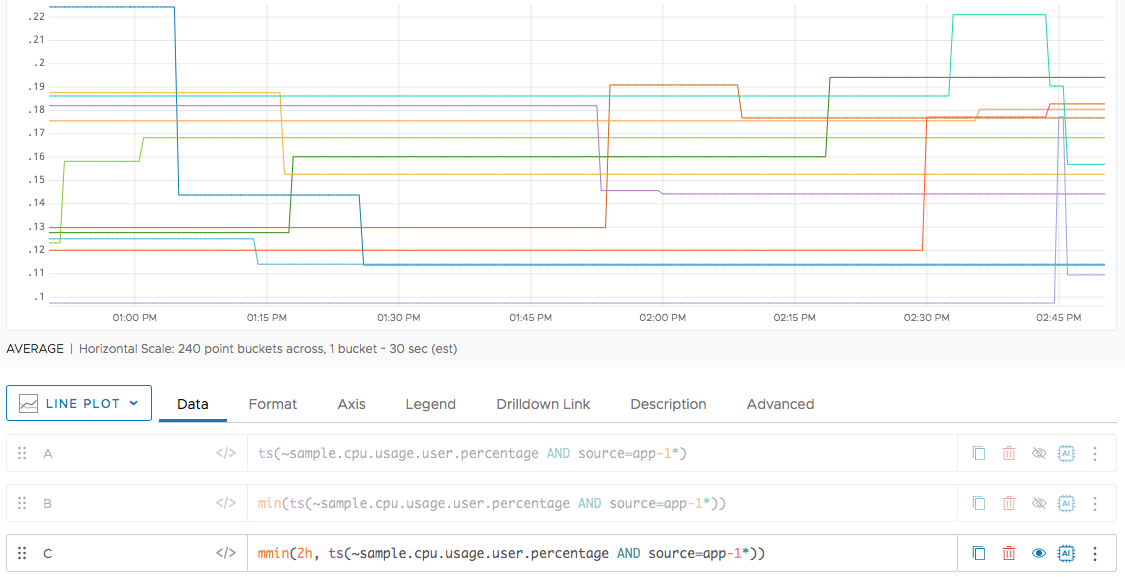
In contrast, when we apply mmin() we get the minimum for each time window for each time series.