Reference to the mchanges() function
Summary
mchanges(<timeWindow>, <tsExpression>)
Returns the number of times that the value of the expression changed within the specified time window.
Parameters
| Parameter | Description |
|---|---|
| timeWindow | Amount of time in the moving time window. You can specify a time measurement based on the clock or calendar (1s, 1m, 1h, 1d, 1w), the window length (1vw) of the chart, or the bucket size (1bw) of the chart. Default is minutes if the unit is not specified. |
| tsExpression | Expression that describes the time series you want the number of changes in the given time window. |
Description
The mchanges() function reports how often a time series value changes within a specified moving time window. For example, mchanges(10m, ts(my.metric)) returns, at each point, the number of times that mymetric changed direction over the last 10 minutes.
You can use this function to see whether a service experiences great fluctuations in either direction.
Examples
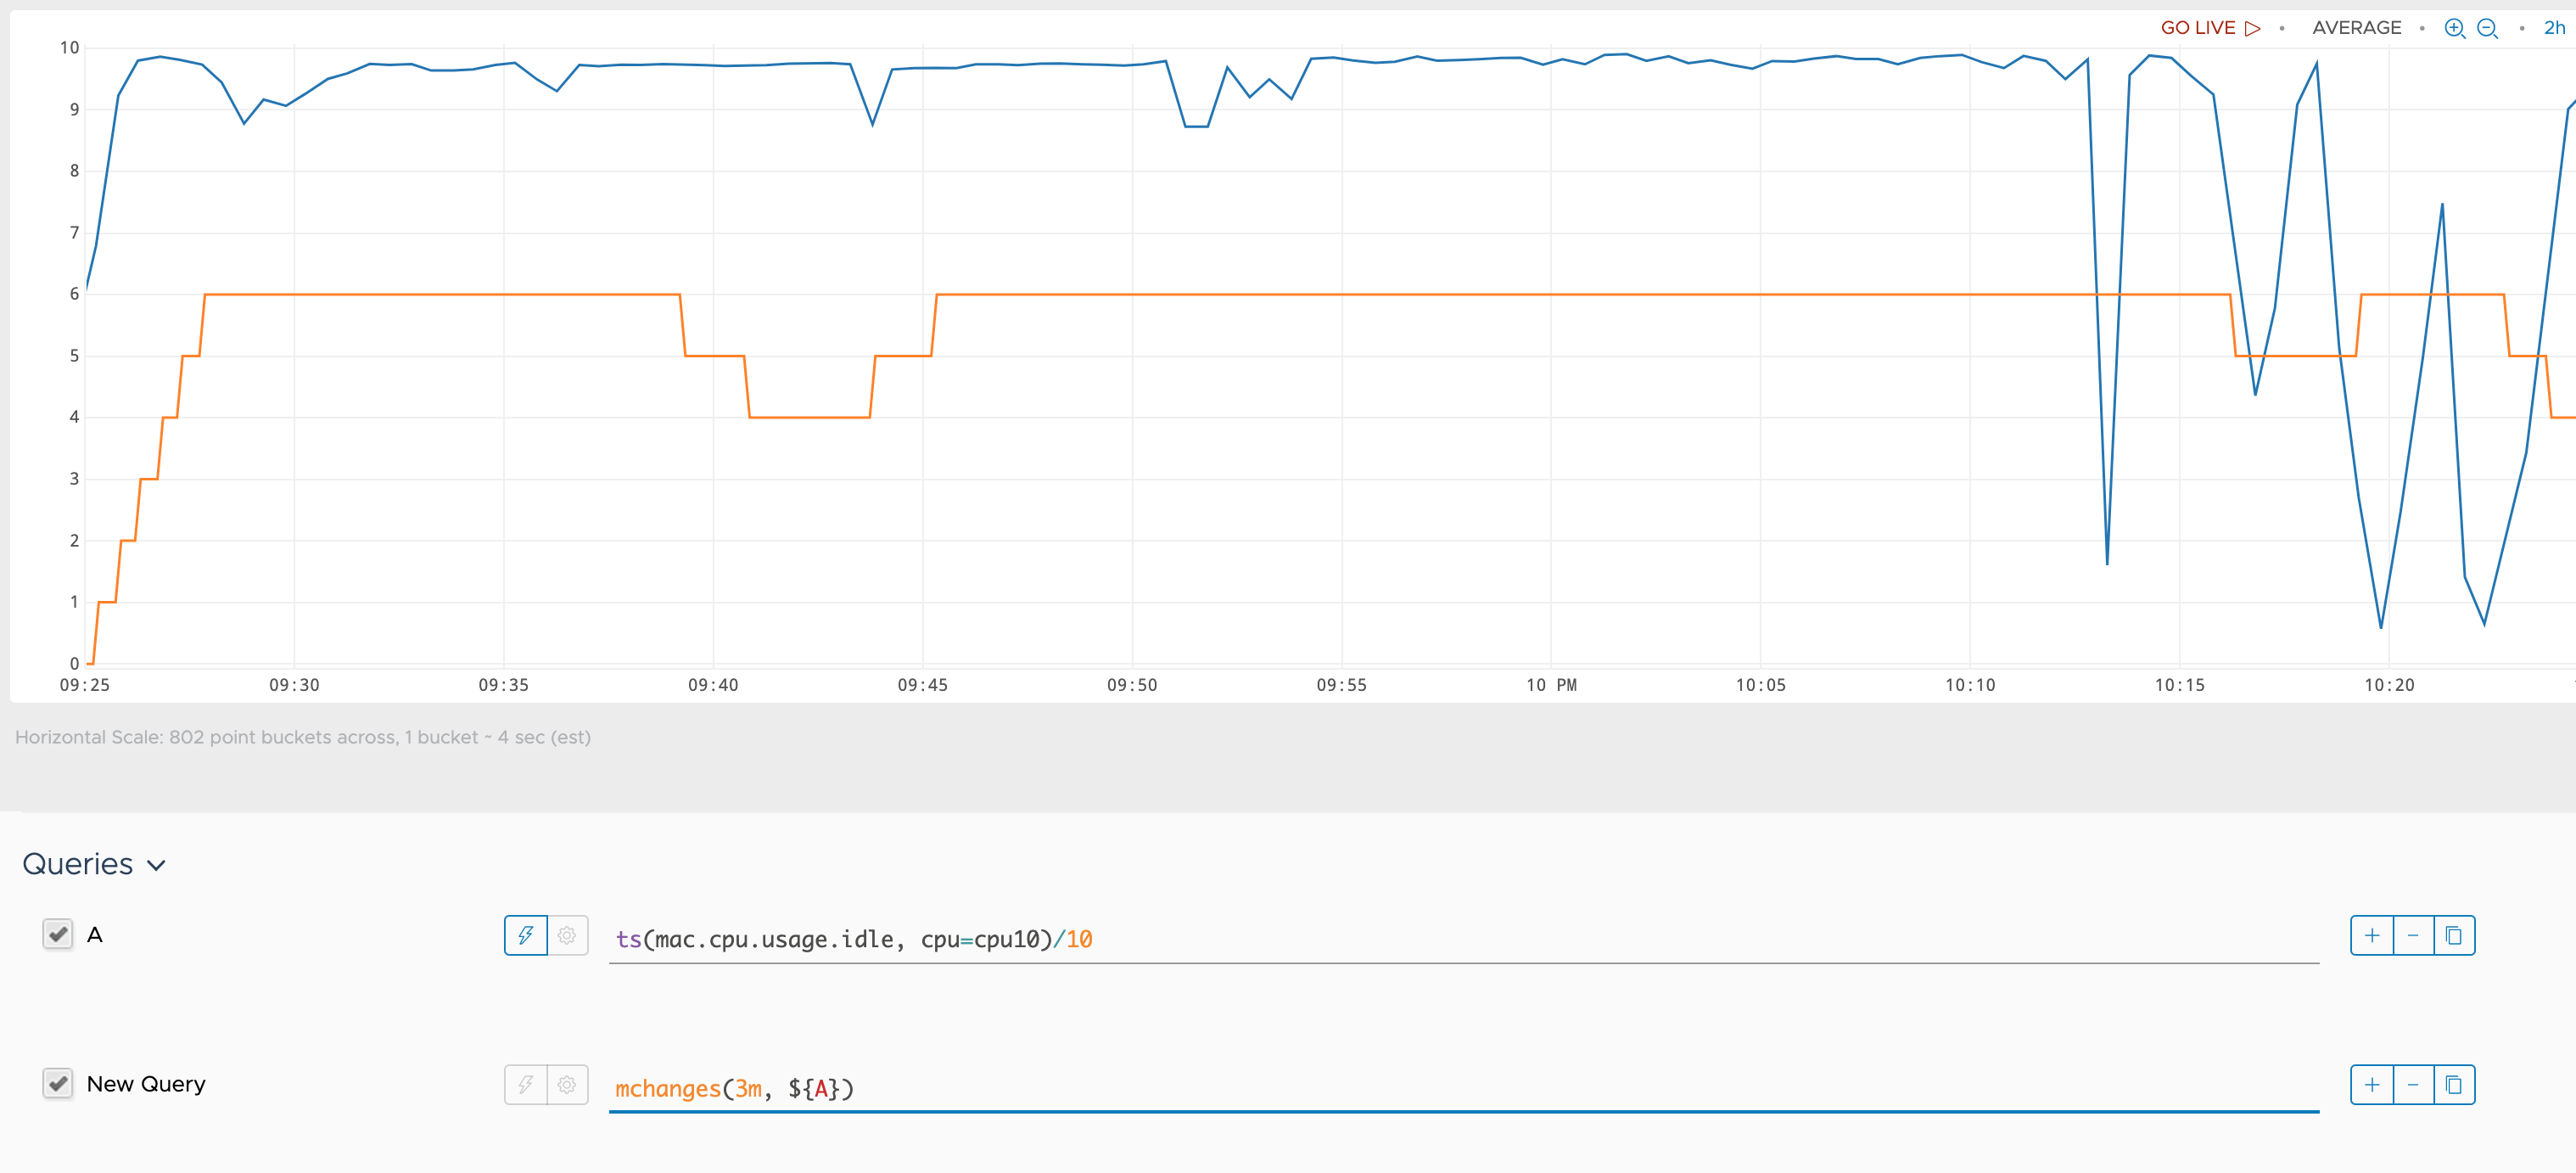
In the following example, mchanges() shows changes in the cpu.usage metric for a 3m timeWindow.
- At the beginning we see growth because every second adds points to those in the previous 3m time window. As the number of points increases, the number of changes increases correspondingly.
- When the number of points in the 3m time window becomes constant, the number of changes also becomes constant.
- In time windows where the
cpu.usagemetric has two or three sequential values that are equal, the result ofmchanges()goes down.
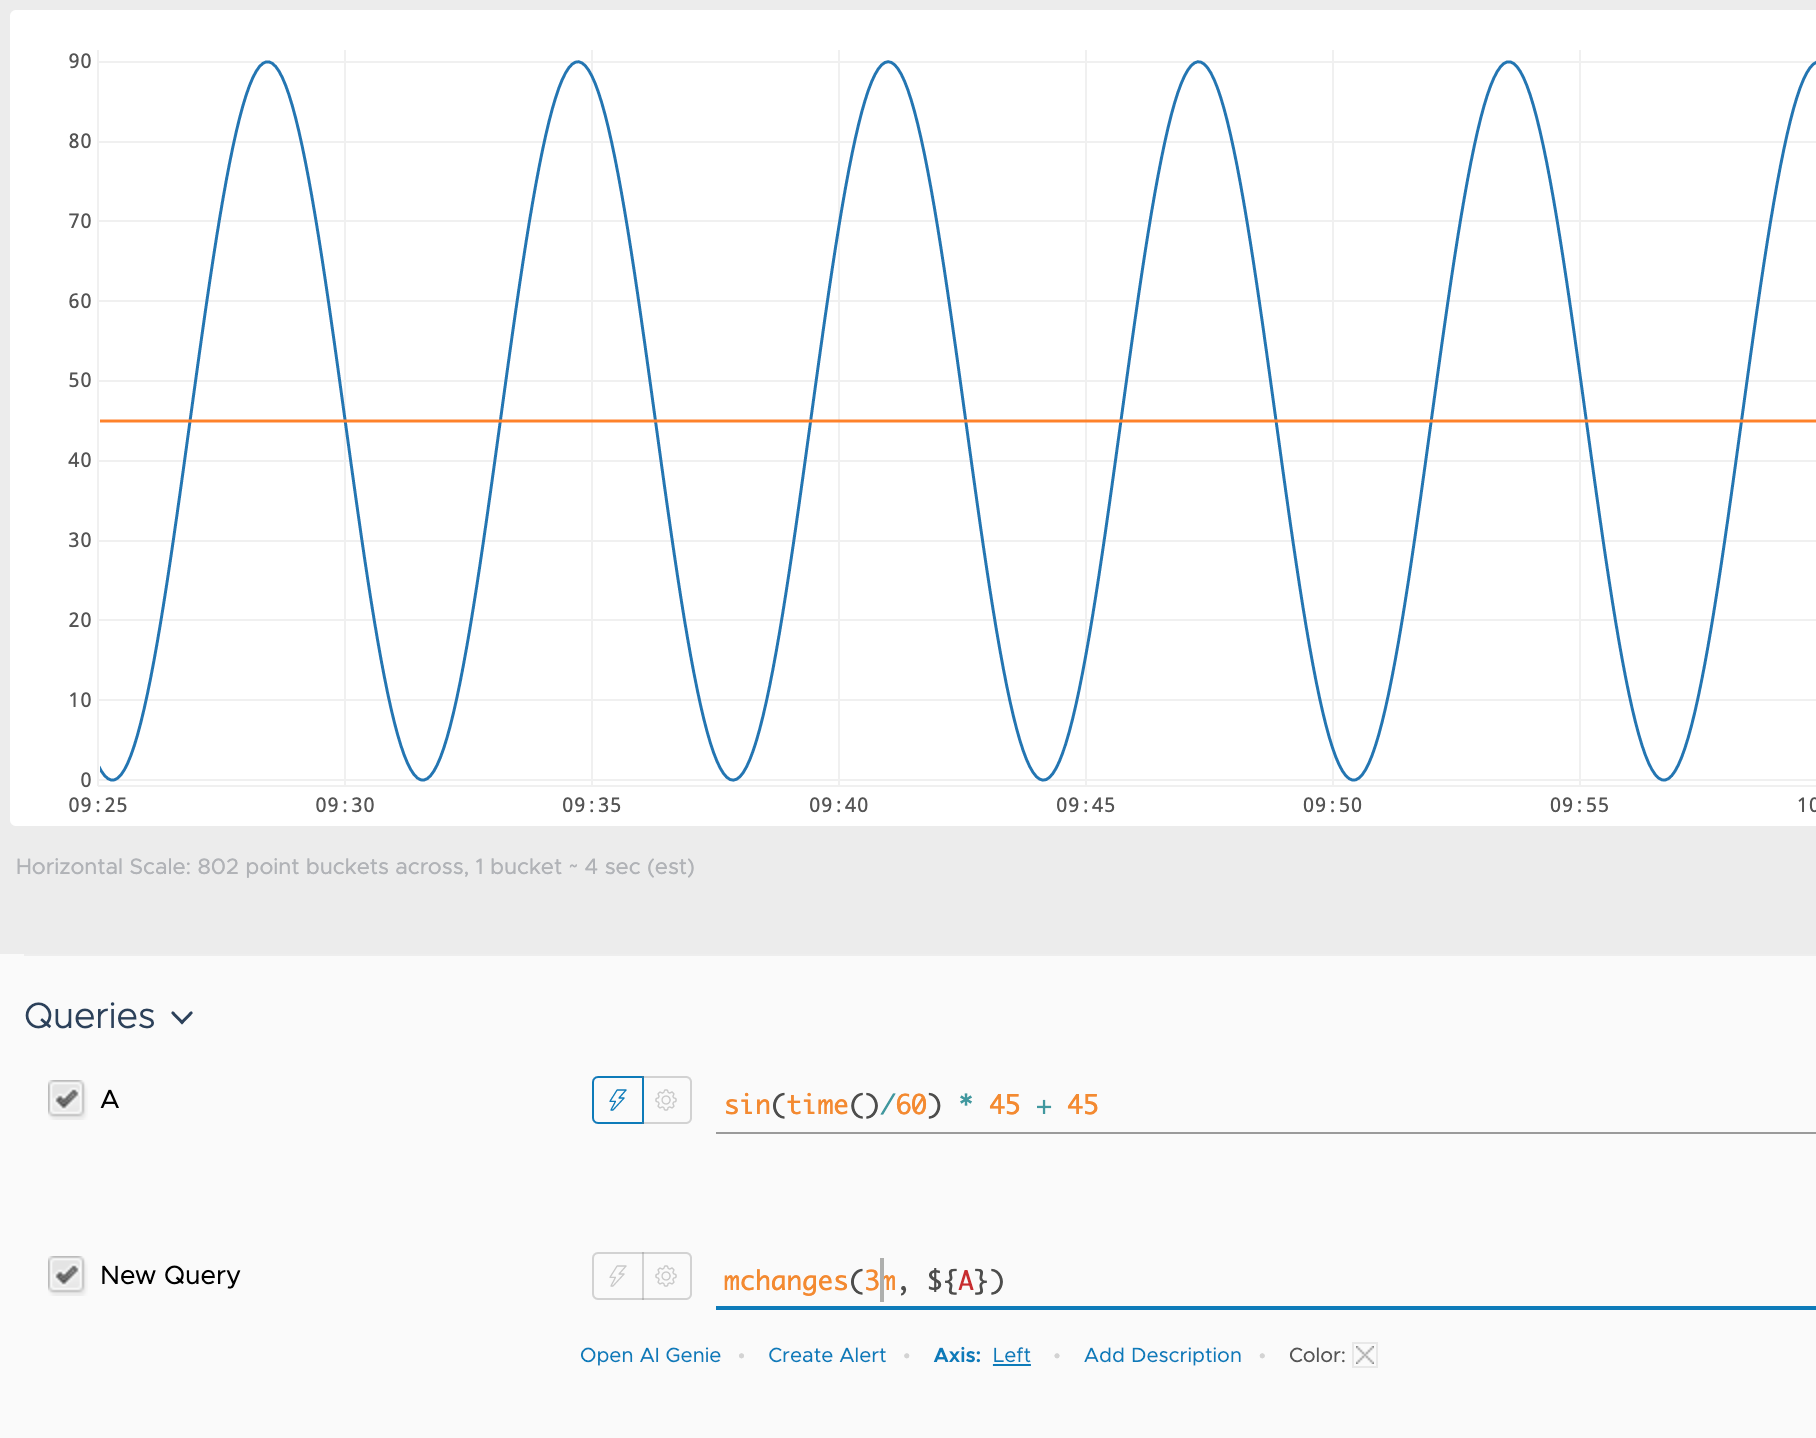
In the following example sin(time()) returns metrics with constantly changing values (blue line). As a result, mchanges() returns a constant value as well (red line).
See Also
- The
flappingfunction returns the number of times a counter has reset within the specified time window.