Summary
histo(<timeWindow>, <tsExpression>[,metrics|sources|sourceTags|pointTags|<pointTagKey>])
Returns a histogram distribution for a time series described by the expression. Charts that display results show the median unless you use percentile() to change that.
Parameters
| Parameter | Description |
|---|---|
| timeWindow | Amount of time in the moving time window. You can specify a time measurement based on the clock or calendar (1s, 1m, 1h, 1d, 1w), the window length (1vw) of the chart, or the bucket size (1bw) of the chart. Default is minutes. |
| tsExpression | Expression describing the time series for which you want to see the histogram distribution. |
| metrics|sources|sourceTags|pointTags|<pointTagKey> | Optionalgroup by parameter for organizing the time series into subgroups and then returning each histogram subgroup.
Use one or more parameters to group by metric names, source names, source tag names, point tag names, values for a particular point tag key, or any combination of these items. Specify point tag keys by name. |
Description
The histo() function returns a histogram for a time series. By default, charts display the median of that histogram, that is, each datapoint is the median of a distribution for each time window specified in the function.
The histo() and percentile() Functions
- You use
histo()to turn a time series into a histogram. - You can use
percentile()turn a histogram into a time series (more precisely, to get a time series for the specified percentile of the histogram).
Grouping
Similar to aggregation functions for metrics, histo() returns a single distribution per specified time window. To get separate distributions for groups that share common characteristics, you can include a group by parameter. For example, use histo(1m, <expression>, sources) to group by sources.
The function returns a separate series of results for each group.
You can specify multiple ‘group by’ parameters to group the time series based on multiple characteristics. For example, histo(1vw, ts("dataingester.report-points"), sources, tags) first groups by source, and then groups by point tag.
zone and ZONE, when you use an aggregation function and apply grouping, we consider zone and ZONE as separate tags. Interpolation
The histo() function itself doesn’t perform interpolation because that doesn’t make sense for a histogram. But when you apply percentile(), we do perform interpolation.
See Standard Versus Raw Aggregation Functions.
Example
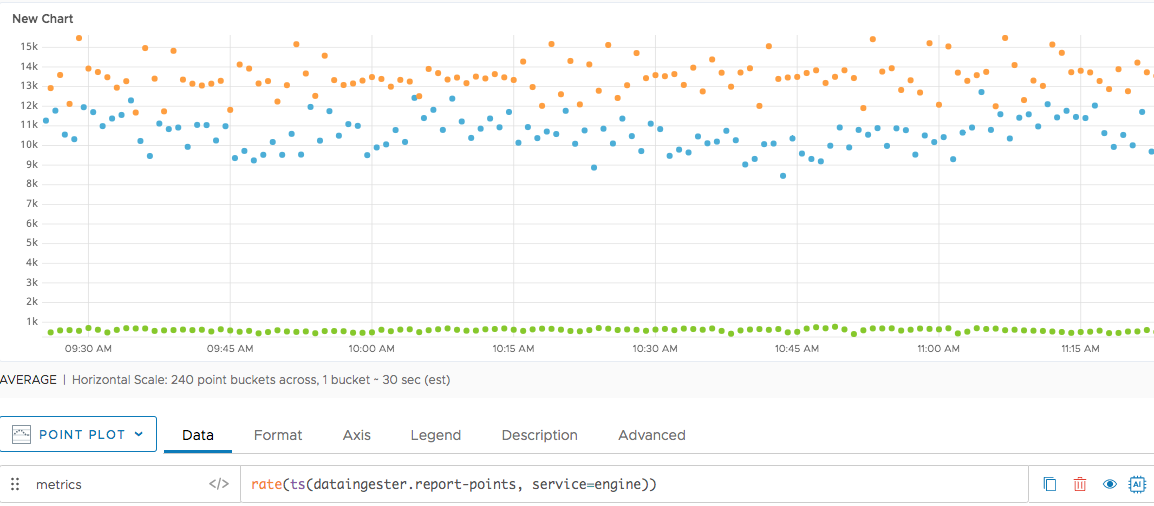
In this example, we’re looking at some metrics and filter to show only 3 time series.
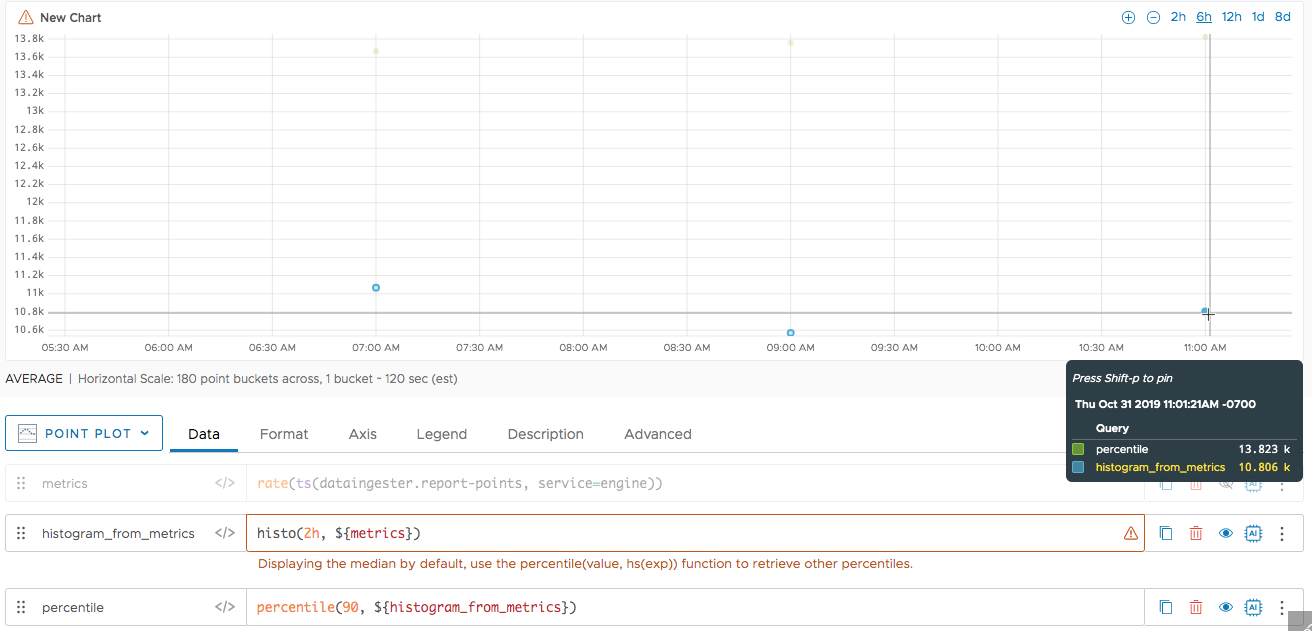
Then we run histo() and can see the following in the example below:
- The example shows 3 points for each query. That’s because we’re specifying a 2 hour time window in the query, and looking at a 6 hour time window.
- In the second query (histogram_from_metrics) we get the median of the histogram distribution that’s created from the metrics.
- In the third query, we get the 90th percentile of the histogram.
See Also
- Our histogram doc page gives background information.
- The median() function returns time series that consist of the median values of the histogram distributions described by an expression.
Caveats
If you want to convert metrics at query time, histo() does that for you. However, ingesting first-class histogram distributions is the faster, more accurate and preferred approach to working with histograms.