This page provides an overview of what you can do with the Apache Solr integration. The documentation pages only for a limited number of integrations contain the setup steps and instructions. If you do not see the setup steps here, navigate to the Operations for Applications GUI. The detailed instructions for setting up and configuring all integrations, including the Apache Solr integration are on the Setup tab of the integration.
- Log in to your Operations for Applications instance.
- Click Integrations on the toolbar, search for and click the Apache Solr tile.
- Click the Setup tab and you will see the most recent and up-to-date instructions.
Apache Solr Integration
Apache Solr is a highly scalable and reliable search engine optimized to search large volumes of text-centric data.
This integration installs and configures Telegraf to send Apache Solr server metrics into Wavefront. Telegraf is a light-weight server process capable of collecting, processing, aggregating, and sending metrics to a Wavefront proxy.
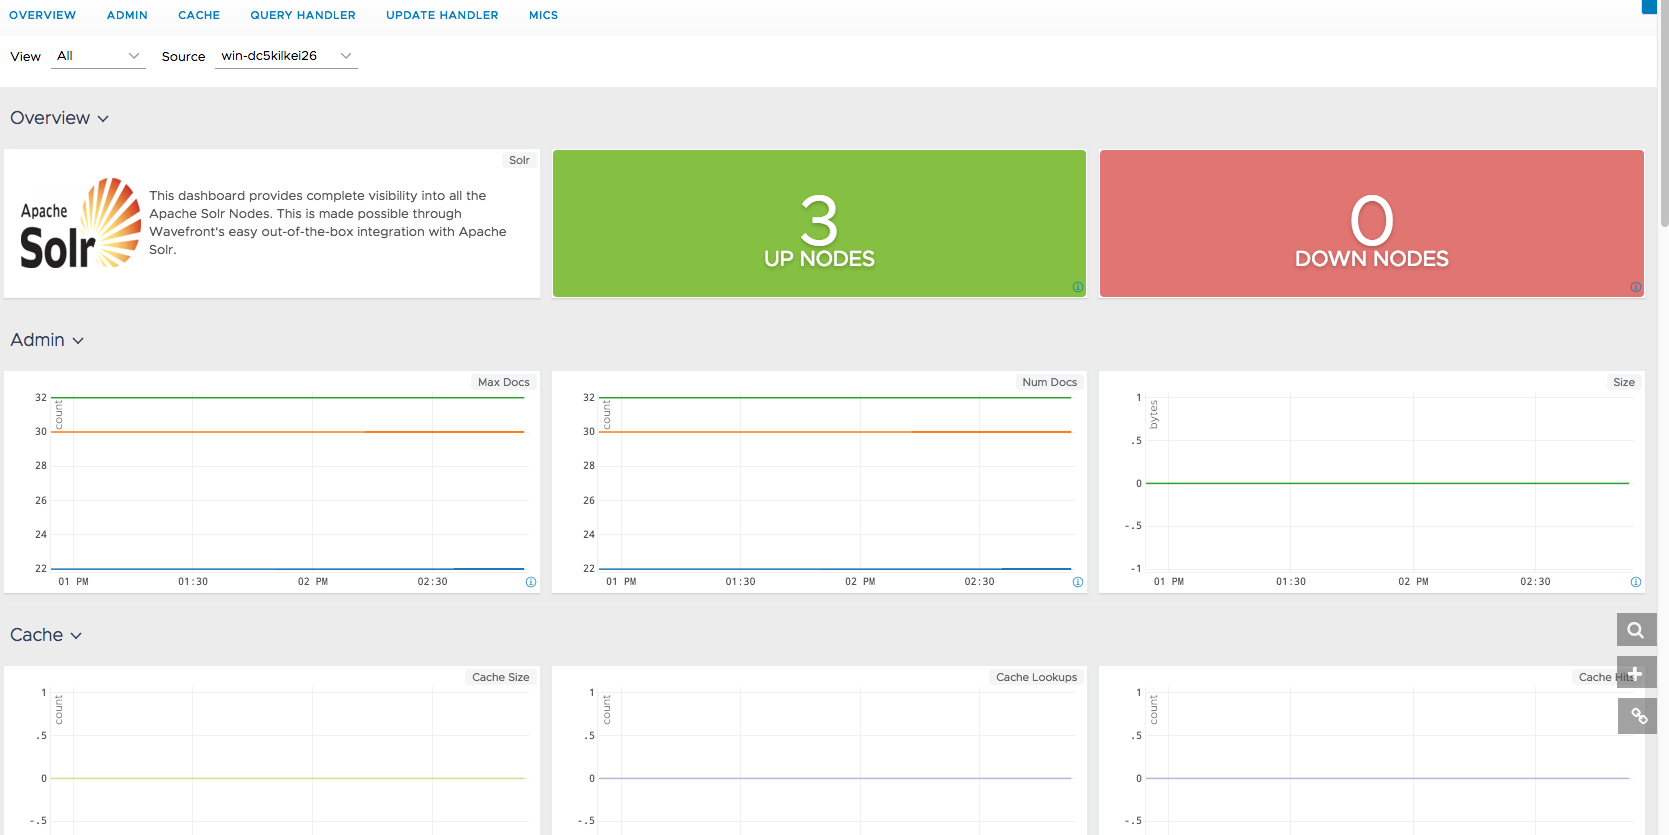
In addition to setting up the metrics flow, this integration also installs a dashboard. Here’s a preview of some charts in the Apache Solr dashboard.
Metrics
| Metric Name | Description |
|---|---|
| solr.admin.deleted.docs | The number of documents deleted per minute. |
| solr.admin.max.docs | The maximum number of documents that can be added per minute. |
| solr.admin.num.docs | The number of documents added per minute. |
| solr.admin.size.in.bytes | The total memory size in bytes. |
| solr.cache.cumulative.evictions | The number of cache evictions across all caches since this node has been running. |
| solr.cache.cumulative.hitratio | The percentage of queries that were satisfied by the cache (a number between 0 and 1, where 1 is ideal). |
| solr.cache.cumulative.hits | The number of cache hits across all the caches since this node has been running. |
| solr.cache.cumulative.inserts | The number of cache insertions across all the caches since this node has been running. |
| solr.cache.cumulative.lookups | The number of cache lookups across all the caches since this node has been running. |
| solr.cache.evictions | The number of cache evictions for the current index searcher. |
| solr.cache.hitratio | Ratio of cache hits to lookups for the current index searcher. |
| solr.cache.hits | The number of hits for the current index searcher. |
| solr.cache.inserts | The number of inserts into the cache. |
| solr.cache.lookups | The number of lookups against the cache. |
| solr.cache.size | Size of the cache at that particular instance (in KBs). |
| solr.cache.warmup.time | Warm-up time for the registered index searcher. This time is taken in account for the “auto-warming” of caches. |
| solr.core.deleted.docs | The number of documents deleted from the collection per minute. |
| solr.core.max.docs | The maximum number of documents that can be added to a collection per minute. |
| solr.core.num.docs | The number of documents added into a collection per minute. |
| solr.queryhandler.requests | The total search requests handled by the corresponding Solr cores per minute. |
| solr.queryhandler.timeouts | The total timeouts that occur during the search requests handled by the corresponding Solr cores per minute. |
| solr.queryhandler.errors | The total errors that occur during the search requests handled by the corresponding Solr cores per minute. |
| solr.queryhandler.avg.requests.per.second | The average number of search requests received per second. |
| solr.queryhandler.avg.time.per.request | The average time taken for handling the search requests. |
| solr.queryhandler.total.time | The total time for the search requests. |
| solr.queryhandler.75th.pc.request.time | Request processing time in milliseconds for the request which belongs to the 75th Percentile. E.g., if 100 requests are received, then the 75th fastest request time will be reported in this statistic. |
| solr.queryhandler.95th.pc.request.time | Request processing time in milliseconds for the request which belongs to the 95th Percentile. E.g., if 100 requests are received, then the 95th fastest request time will be reported in this statistic. |
| solr.queryhandler.99th.pc.request.time | Request processing time in milliseconds for the request which belongs to the 99th Percentile. E.g., if 100 requests are received, then the 99th fastest request time will be reported in this statistic. |
| solr.updatehandler.docs.pending | The number of documents pending commit. |
| solr.updatehandler.errors | Number of error messages received while performing addition, deletion, commit, or rollback actions on documents over the lifetime of the core. |