This page provides an overview of what you can do with the Nagios integration. The documentation pages only for a limited number of integrations contain the setup steps and instructions. If you do not see the setup steps here, navigate to the Operations for Applications GUI. The detailed instructions for setting up and configuring all integrations, including the Nagios integration are on the Setup tab of the integration.
- Log in to your Operations for Applications instance.
- Click Integrations on the toolbar, search for and click the Nagios tile.
- Click the Setup tab and you will see the most recent and up-to-date instructions.
Nagios Integration
Nagios is a popular open source computer system and network monitoring application software. It watches hosts and services that the owner specifies, alerting the owner when things go wrong and again when they get better.
This integration configures Nagios to send data from hosts and services to Operations for Applications. Metrics show up in the Nagios dashboard. Events show up as Operations for Applications events.
Dashboards
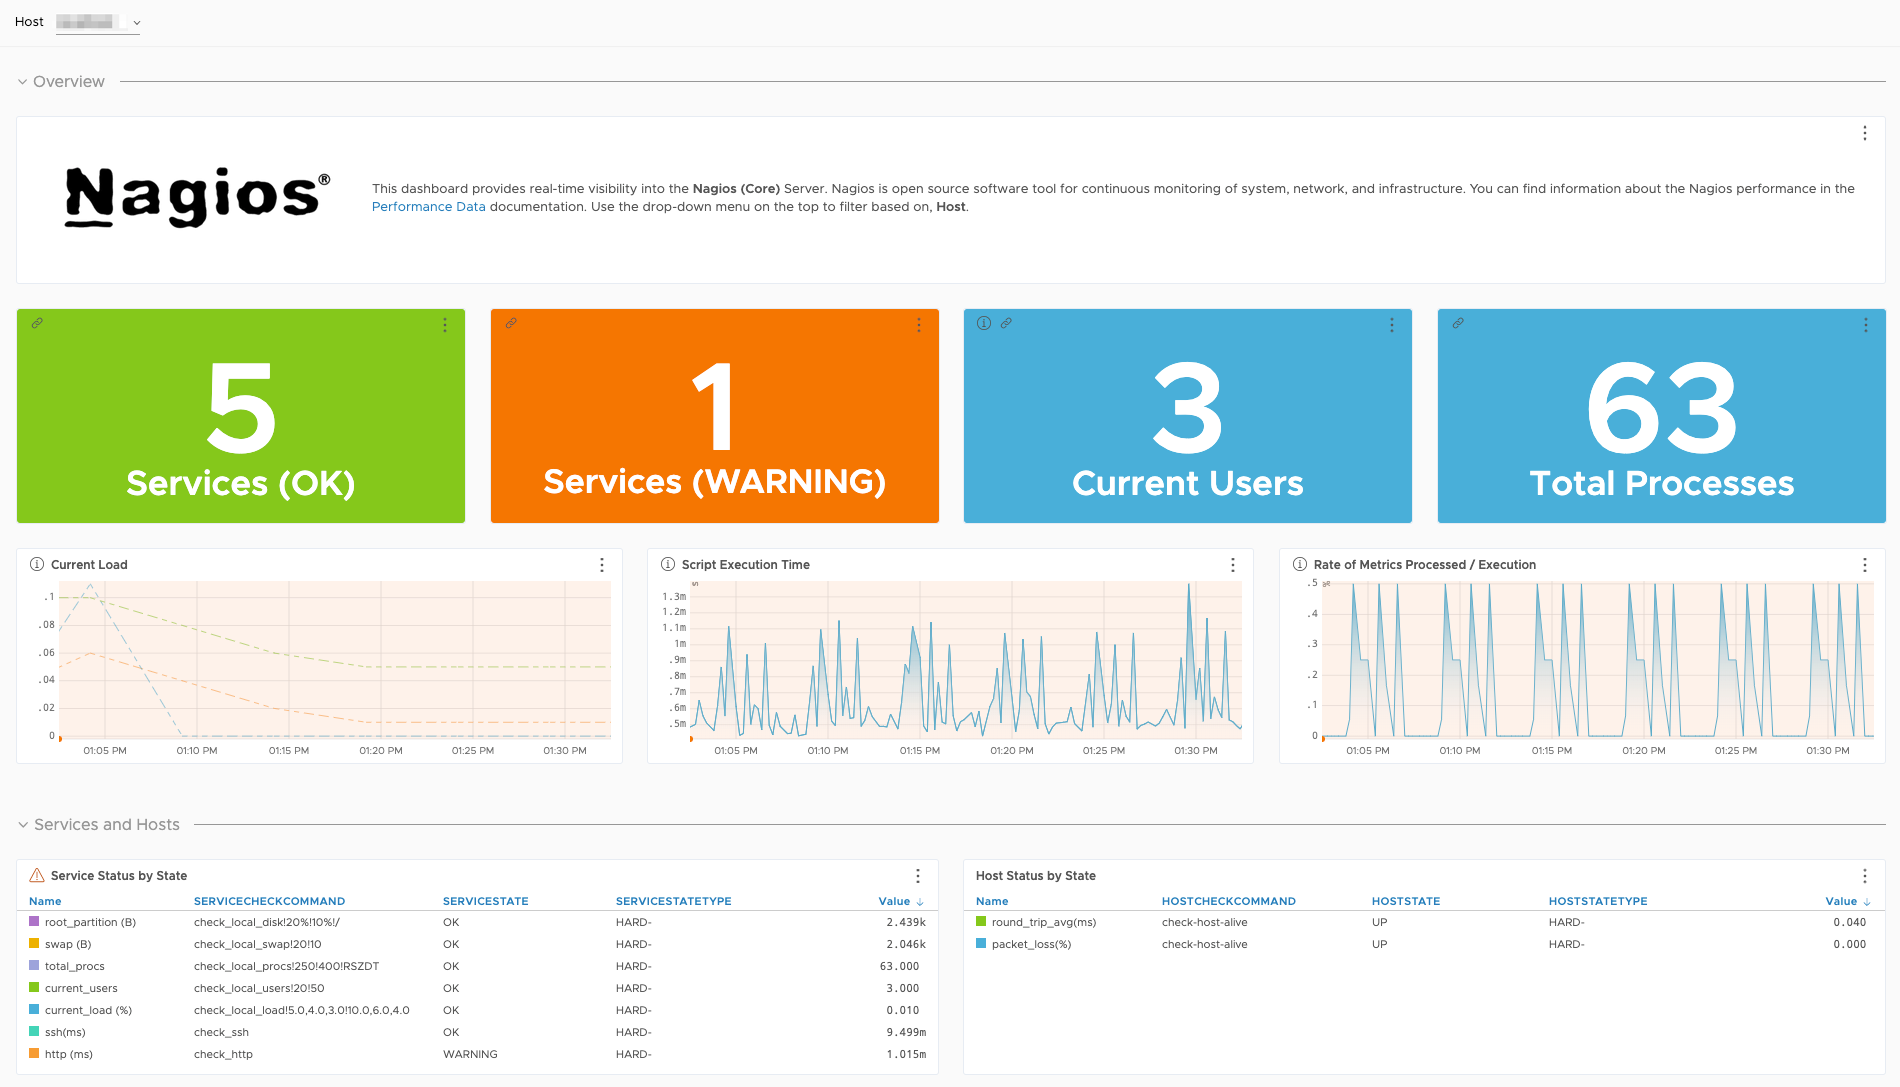
In addition to setting up the metrics flow, this integration also installs a dashboard. Here’s a preview of the Nagios dashboard:
Metrics
| Metric Name | Description |
|---|---|
| nagios.host.pl | The host command to probe the specified host for packet loss (%) |
| nagios.host.rta | The host command to probe the specified host for round trip average travel time (ms) |
| nagios.metrics.processed.per.execution | Custom metric: The number of metrics processed in an execution (count) |
| nagios.script.execution.time | Custom metric: The time taken by the script to process metrics per execution (s) |
| nagios.service.current.load.load1 | The current system load average over 1 minute |
| nagios.service.current.load.load15 | The current system load average over 5 minutes |
| nagios.service.current.load.load5 | The current system load average over 15 minutes |
| nagios.service.current.users.users | The number of users currently logged in on the local system |
| nagios.service.http.size | The HTTP check command response message size (Bytes) |
| nagios.service.http.time | The HTTP check command response time (s) |
| nagios.service.ping.pl | The ping command to probe the specified host for packet loss (%) |
| nagios.service.ping.rta | The ping command to probe the specified host for round trip average travel time (ms) |
| nagios.service.root.partition | The amount of used disk space on a mounted file system (MB) |
| nagios.service.ssh.time | The time taken to connect to an SSH server at specified server and port |
| nagios.service.swap.usage.swap | The swap memory usage on machine (MB) |
| nagios.service.total.processes.procs | The number of currently running processes |